Bridge - Ultrasonic Tomography (UST)
Target of Investigation
UPE method is primarily used to inspect interiors of concrete structural members and tunnel linings for the following applications:
- Measuring thickness of concrete members.
- Detecting voids in grouted tendon ducts.
- Detecting poor bonding or debonding of overlays and repairs.
- Detecting delaminations.
- Detecting voids and honeycombing in concrete members.
- Locating ducts and reinforcement in concrete structures, like rebars, strands, and tendons.
- Quality assurance/quality control (QA/QC) during construction of reinforced and prestressed concrete elements.
- Detecting voids behind tunnel linings and below slabs on grade.
Description
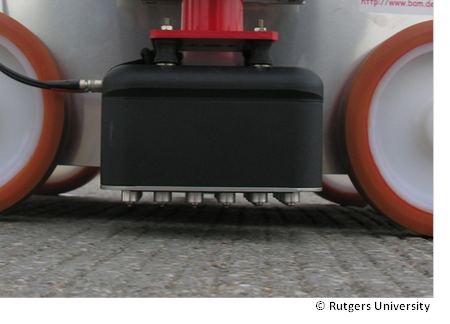
The UPE method involves using dry contact transmitting and receiving ultrasonic transducers in a “pitch-catch” configuration which emit shear waves into the concrete and detect and record reflections from objects of different acoustic impedances. UPE equipment is available in different sizes, varying from two transducers to a large number of transducers in an array arrangement (figure 1).
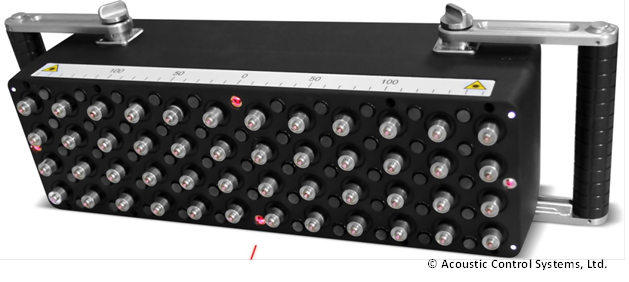
Some systems use multiple transducers to serve as transmitters and receivers to accelerate the ultrasonic data acquisition, enhance the signal to noise ratio, and minimize effects of wave scattering from aggregate particles and similar inhomogeneities in concrete structures. Such systems with a large number of transducers are used for ultrasonic tomography.(1) A device known as MIRA, with an array of forty-eight low-frequency broadband shear transducers, is shown in figure 2. While one of the rows of transducers is acting as a transmitter, the remaining rows of transducers are acting as receivers. Each transducer is mechanically isolated and dampened independently that can fit the profile of a rough concrete testing surface.
Physical Principle
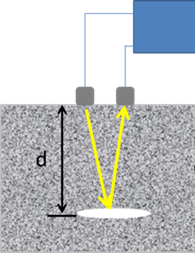
The UPE method involves generating and recording ultrasonic compression and shear waves being propagated through the surveyed object and reflected from objects of different acoustic impedances. As illustrated in figure 3, the transducer probe generates the wave field while the receiving probe detects and records the reflected waves. UPE testing defines the depth of the reflector (internal flaws such as cracking, voids, delamination, or horizontal cracking) by measuring the round trip travel time (Δt) of the pulse and using the wave propagation velocity (C) in the investigated material.(2) The calculation of depth (d) is illustrated in figure 4.

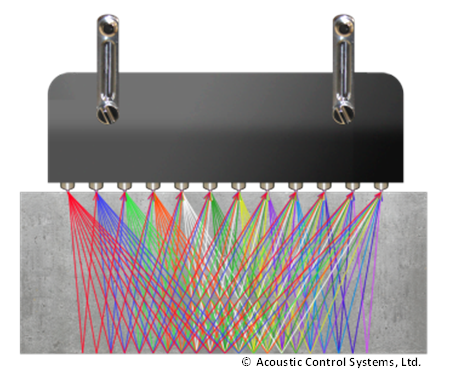
When the transducers are enclosed in an array box (figure 1), the control unit in the antenna excites the first three rows of transducers, and the other rows of transducers act as receivers. In an ultrasonic tomography device with an array of forty-eight shear transducers, while one of the rows of transducers is acting as a transmitter, the remaining rows of transducers are acting as receivers. The ray paths for the measured transit time are shown in figure 5. This process is repeated until each of the rows of transducers has acted as transmitters.
In general, it is critical to have good coupling between the surface and the transducers. In the past, coupling was achieved by using coupling media. Some newer systems have the individual transducers spring loaded to conform to the surface and, thus, do not require any couplants. The nominal center frequency for units using shear waves is usually between 20 to 200 kHz. For most concrete applications, a center frequency of 50 kHz will yield better results.
Data Acquisition
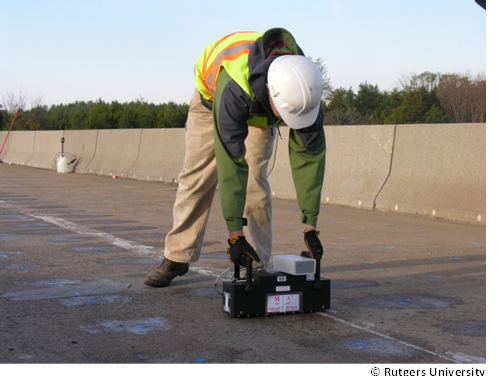
The UPE system consists of transducers, a portable computer with analysis software, and a data cable that connects the sensor unit to the portable computer. For ultrasonic tomography, the transducers and the electronics are mounted in a handheld box to be applied on concrete surfaces. Figure 6 shows data collection with an ultrasonic tomographer known as MIRA.
While it is necessary to adapt test procedures to the needs of the desired application, the basic steps for different collection modes are described herein. Before the start of the actual testing, check the instrument settings by examining a few locations with known conditions. This is described as a review or explore mode. The actual testing should be conducted on a pre-defined grid to obtain a complete data set for the element surveyed. This is described as the map or scan mode.
Data Processing
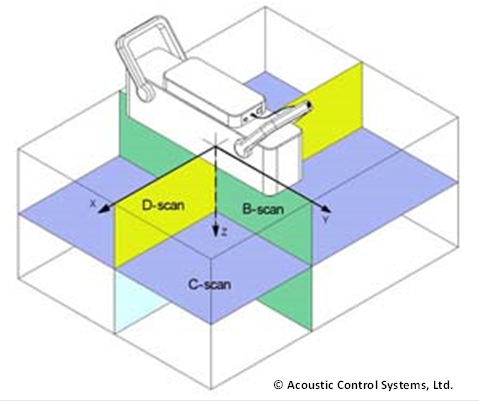
After all the data are collected and stored, a data reconstruction calculation, Synthetic Aperture Focusing Technique (SAFT), is performed, resulting in a 3-D representation of the surveyed objects with features in the image indicating reflections from objects and discontinuities. In the 3-D volume, the position and strength of reflections from identified reflectors are presented by a color scheme and can be used to obtain the actual position and shape of the reflector. The 3-D volume can be examined by presenting various cutting vertical or horizontal planes. Images of detected features in three such planes, termed the B-scan, C-scan, and D-scan, are shown in figure 7. The B-scan is an image slice showing the depth of the specimen on the vertical (z) axis versus the width of scan on the horizontal (x) axis. This slice is a plane perpendicular to the scanning surface and parallel to the length of the device. The C-scan is an image slice showing the plan view of the tested area, with the vertical (y) axis of the scan depicting the width parallel to the scanning direction and the horizontal (x) axis of the scan, representing the length perpendicular to the scanning direction. The D-scan is like the B-scan which images a plane perpendicular to the testing surface, but it is oriented parallel to the scanning direction.
Data Interpretation
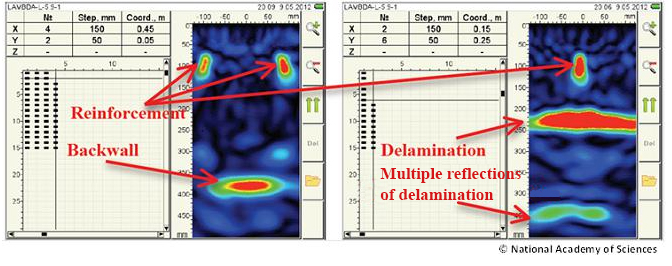
The 3-D visualization along with different plane sections (B-, C-, and D-scans) can be used to interpret the data. A color template is used to describe features depending on the strength of reflection of ultrasonic waves. In most cases, low reflectivity is described using cold colors (blues and greens), while high reflectivity is presented using hot colors (reds and yellows). High reflectivity will in most cases be an indication of presence of objects and discontinuities, like reinforcement, cracks, delaminations, and voids. Low reflectivity in most cases will represent a sound condition. Figure 8 shows a typical B-scan as viewed in the equipment display for several types of features and defects encountered during inspections.
The following are guidelines for interpreting data for common defects and features:
- Backwall (element thickness): Measuring the thickness of an element is based on the evaluation of the travel time of an ultrasonic wave reflected from the backwall. To get a clear reflection from the backwall, it is necessary to have a string contrast in acoustic impedances of the element material and material behind the backwall. Detecting the backwall of an element is illustrated in the left side of figure 8, identified by a high-amplitude reflection plotted in red. The horizontal shape of reflection is an indication of a constant thickness of the element.
- Reinforcement, conduit, tendons, etc.: Reinforcement, conduit, tendons, and other cable-like objects are identified as localized high-intensity reflections, as shown in figure 8. Similar to the backwall detection, there must be a contrast in acoustic impedances of concrete and the objects. The most effective way to detect the objects is by scanning perpendicular to the direction of their layout. A single scan will identify a linear object as a circular or oval high-amplitude (red) region. The position and orientation of a linear object is defined from numerous parallel scans across the object. It is generally not possible to identify the material type. Examining the phase of the reflection can provide some insight on whether the reflector is of acoustic impedance higher or lower than the surrounding concrete. Rebars are most commonly recognized by a regular spacing between the detected objects.
- Delamination: Similar to the backwall, delamination is identified as a high-amplitude linear reflection shallower than the backwall. Therefore, it is necessary to establish the position of the backwall. Since delamination is often a curved and inclined surface, it may appear as a linear object of a variable depth, as illustrated in figure 8. Since a delamination prevents propagation of an ultrasonic wave below it, the backwall is usually not visible at delamination locations. Instead, ultrasonic waves get confined between the delamination and the top surface, which may result in multiple equally-spaced reflections with depth in the B-scan.
- Air- and water-filled voids: Voids appear as high amplitude reflections of a finite size. Because both air- and water-filled voids are of a lower acoustic impedance than concrete, it is nearly impossible to determine whether the void is filled with water.
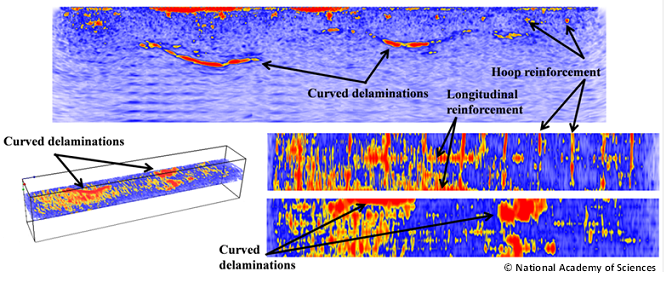
A sample color-coded 3-D image of a surveyed element is presented in figure 9. The color scheme is scaled based on the intensity variations of the reflected shear waves received by the transducer array. With this intensity scaling, any discontinuities in hot color are readily apparent, with distinctively different wave speeds.
Advantages
- Reliable, repeatable, and consistent results.
- Easy field operation.
- Real-time data collection and processing.
- Additional benefits when using ultrasonic tomography array:
- Tomographic data present volumetric and informative image of the surveyed element.
- Requires low to medium level of expertise for equipment setup and data collection with modern equipment.
- Surface preparation not required because of dry point contact transducers.
Limitations
- Time consuming and labor intensive.
- Low data collection speed.
- No discernible information deeper than the first air interface.
- Difficult to detect additional reinforcement below two layers of reinforcement.
- Requires considerable engineering judgment to properly evaluate a measurement.
- Possible misinterpretation when poor contact is made.
References
- Kozlov, V.N., et. al., “Ultrasonic Equipment for Evaluation of Concrete Structures Based on Transducers with Dry Point Contact,” In Proceedings of the NDE Conference on Civil Engineering, St. Louis, MO, 2006, pp. 496–498.
- American Concrete Institute Committee 228, Nondestructive Test Methods for Evaluation of Concrete in Structures, ACI 228.2R-98, 1998.


