Bridge - Ultrasonic Surface Waves (USW)
Target of Investigation
The ultrasonic surface waves (USW) technique has the following applications:(1)
- Concrete quality control and evaluation (modulus and strength, using the correlation with modulus).
- Indirect assessment of delamination in bridge decks.
- Estimates of the depth of vertical cracks within bridge decks or other elements.
- Condition assessment through evaluating probable material damage from various causes: alkali-silica reaction (ASR), fire, freeze-thaw, and other cracking processes.
Description
The USW technique is an offshoot of the spectral analysis of surface waves (SASW) method used in evaluating material properties (elastic moduli) in the very near surface zone. SASW utilizes the phenomenon of the surface wave dispersion, i.e., velocity of propagation as a function of frequency and wavelength, in layered systems to obtain information about layer thickness and elastic moduli.(2) The USW test is identical to the SASW test except that the frequency range of interest is limited to a narrow high frequency range where the velocity of the surface wave (phase velocity) does not vary significantly with frequency. The surface wave velocity can be converted to the material modulus, concrete modulus in the case of bridge decks, using either the measured or assumed mass density or Poisson’s ratio of the material. A USW test consists of recording the response of the deck at two receiver locations due to an impact on the surface of the deck.
Physical Principle
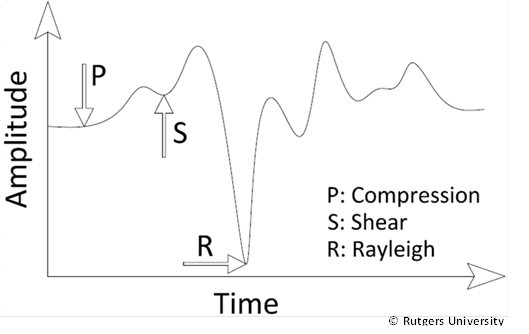
Surface waves are elastic waves that travel along the free surface of a medium and, in most cases, is the predominant part of energy in comparison to body waves—compressive (P- waves) and shear waves (Swaves).(2) The arrival of the surface (Rayleigh) wave follows the arrival of the two body wave components because it is the slowest one (figure 2).
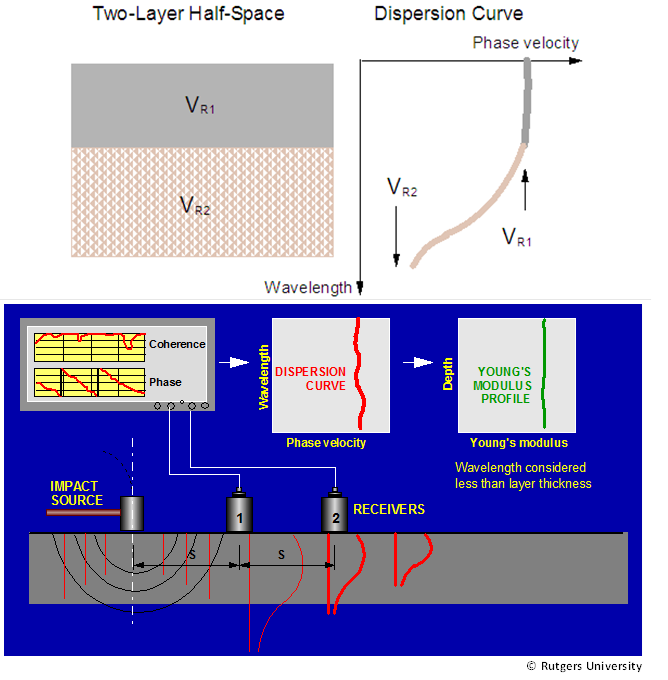
The surface waves propagate radially from the impact source, forming a cylindrical front with a velocity dependent on the elastic properties of the medium. The waves propagating in a heterogeneous medium are dispersive; that is, waves of different wavelengths or frequencies travel with different velocities. Thus, the information about the subsurface can be obtained through measuring the phase velocity versus frequency relationship (dispersion curve) and back calculation of the dispersion curve to obtain the profile of the tested system.
Surface wave energy extends to a depth of approximately one wavelength. At wavelengths less than or equal to the thickness of the layer, the velocity of surface-wave propagation is more or less independent of wavelength (figure 3). Therefore, if the measurement is limited to wavelengths not exceeding the thickness of the deck, the velocity of surface waves will be dependent only on the concrete modulus. An average velocity is used to correlate it to the concrete modulus. Significant variation in the phase velocity indicates the presence of delamination or other anomaly. Elastic waves are generated by means of impacts, detected by a pair or an array of receivers and recorded by a transient recorder.
Data Acquisition
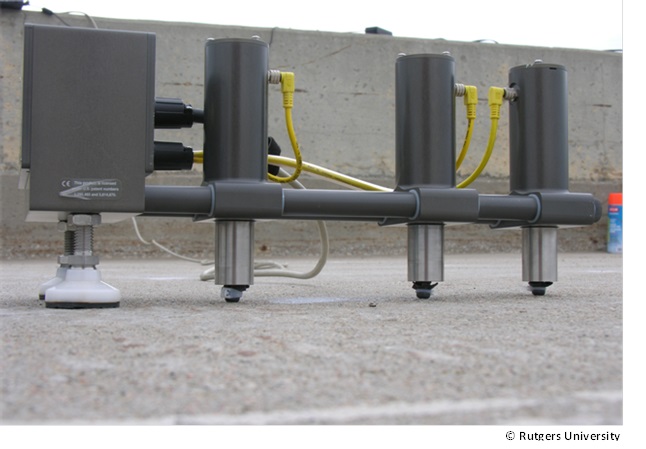
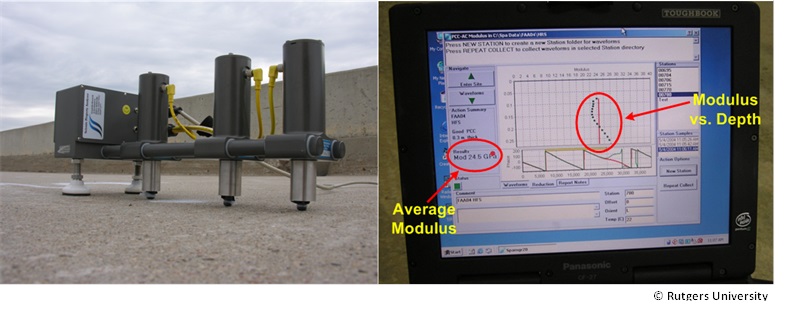
The basic components of USW equipment include a source, at least one pair of receivers, and a portable computer with controls and data acquisition software.(1) The USW equipment enables both automatic and semi-automatic data collection and data processing. Figure 4 shows an example of a simple USW device, called portable seismic property analyzer (PSPA), with a solenoid type impact source and two receivers (accelerometers). Once the device is placed on the ground, a series of impacts from the source is detected by the receiver pair and recorded on a portable computer.
Data Processing
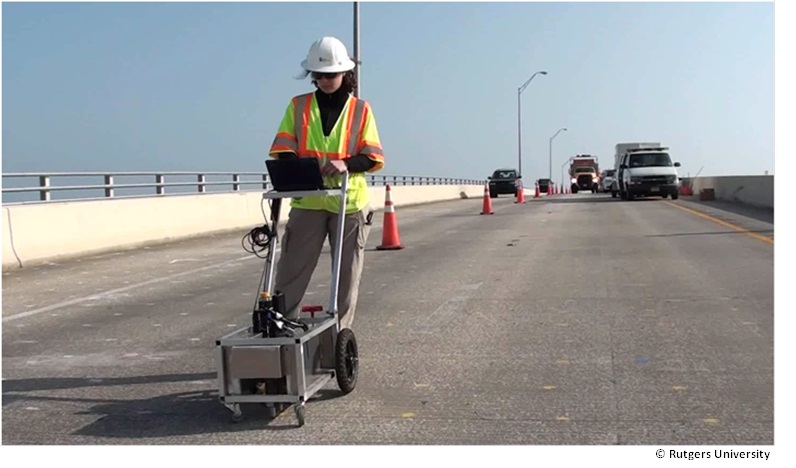
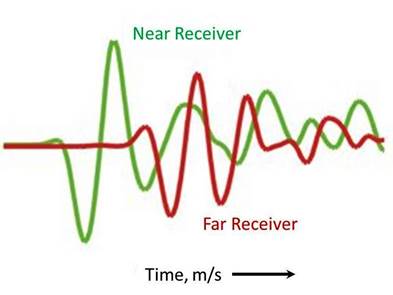
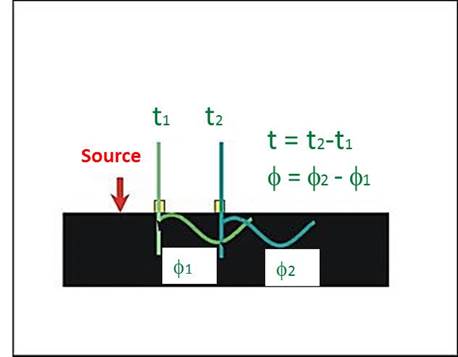
In most systems, compressional waves arrive at the receivers first, followed by shear waves and then surface waves.(3) However, more than two-thirds of the energy in the wave train is in the surface waves, making them more easily studied. Figure 5 illustrates the relative arrival of the wave train at a near and far receiver. Figure 6 shows how a phase lag in the arrival of a wave component to two or more receiver locations can be used to measure the travel time between them. The received signals are processed, and a subsequent calculation scheme is used to calculate the concrete modulus directly in the field (figure 7).(4
Data Interpretation
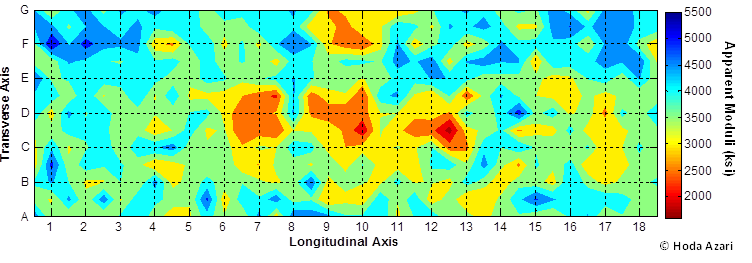
Data from USW testing are typically presented in terms of the concrete modulus distribution (figure 8). Very low modulus is often an indication of presence of delamination or cracking and does not necessarily represent the actual concrete modulus at the test location.
Advantages
- Repeatable.
- Provides modulus of the concrete for appropriate design.
- Can take the place of lab testing of cores or cylinders.
- Can be conducted within hours of construction.
- Can characterize the depth of vertical cracks.
Limitations
- Slower data collection.
- Road and bridge closures necessary for surveying existing pavements.
- Expertise and training required for equipment setup, data collection, data processing, and data interpretation.
- Higher level expertise and experience required to interpret test results for concrete deck deteriorations such as debonding/delamination.
- More complicated SASW modulus evaluation for layered systems like decks with asphalt concrete overlays.
References
- Gucunski, N., et. al., Nondestructive Testing to Identify Concrete Bridge Deck Deterioration, Report S2-Ro6A-RR-1, SHRP2 Renewal Research, Transportation Research Board, 2013.
- Gucunski, N., et.al., Comprehensive Bridge Deck Deterioration Mapping of Nine Bridges by Nondestructive Evaluation Technologies, Project SPR-NDEB(90)-8H-00, Center for Advanced Infrastructure and Transportation, Rutgers University, January, 2011.
- Central Federal Lands Highway, “Spectral Analysis of Surface Waves (SASW) and Ultra Sonic Surface Wave (USW) Methods,” (Website) Lakewood, CO. Accessed online: February 13, 2015. http://www.cflhd.gov/resources/agm/engApplications/Pavements/413SpecAnalySurfWaveandUltrSonicSurfWaveMethods.cfm
- ACI, Nondestructive Test Methods for Evaluation of Concrete in Structures, ACI 228.2R98, American Concrete Institute, June, 2013.
- Azari, H., Yuan, D., Nazarian, S., and Gucunski, N., “Sonic Methods to Detect Delamination in Concrete Bridge Decks: Impact of Testing Configuration and Data Analysis Approach,” Transportation Research Record (TRR): Journal of Transportation Research Board, No. 2292, Transportation Research Board of the National Academics, Washington, DC, pp. 113-124, 2012.


