Bridge - Stress Wave Timing
Target of investigations
Stress wave timing is used to detect the areas of internal decay in wood structures.
Description
Stress wave timing aims to investigate the presence of flaws and decay in wood materials by determining the travel time of stress waves as they propagate from the source to the receiver.
Physical Principle
In undamaged materials, the velocity of stress waves is directly proportional to their elastic modulus. In the presence of flaws, such as checks and splits, however, the velocity tends to decrease and stress wave timing tends to increase. Therefore, waves need to take a longer travel path from the source to the receiver to bypass the flawed region. Furthermore, due to the increased softness of decayed wood, it generally takes longer for stress waves to travel in decayed wood than sound wood of the same type. It is worth noting that since wood is an anisotropic material, its mechanical properties (and subsequently stress wave velocity) are affected by the orientation of propagating waves with respect to grains. Moisture and preservative treatment can also affect the stress wave timing results. In the following paragraphs, factors affecting the stress wave timing results are explained in further detail.
Fiber orientation
The direction of the stress waves propagating in a wood member affects the wave velocity measurements.(1) For structural wood members, fibers are oriented more or less along the length of a member. During measurements, tapping the end grain of a wood member generates longitudinal waves with the highest wave velocity (lowest stress wave transmission time), while tapping the side of a wood member (i.e., across grains) generates transverse waves with the lowest wave velocity (largest stress wave transmission time). For example, for Douglas fir and southern pine, the stress wave transmission times along the grain are approximately 200 µs/m (60 µs/ft), while the transmission times across grains are in the range of 850 µs/m and 1,000 µs/m (259 µs/ft and 305 µs/ft).(1)
Ring orientation
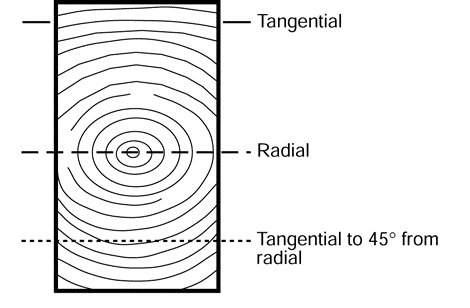
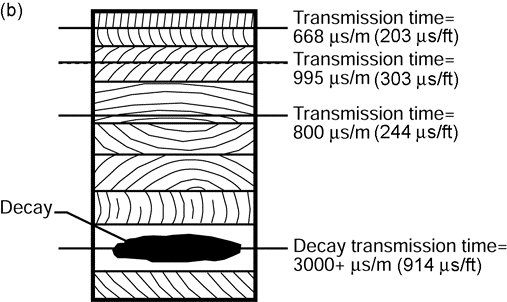
The stress wave transmission time is shortest at the radial direction and longest at 45 degrees to the annual ring orientation (figure 1).(1) In the radial direction, transmission time is approximately 30 percent shorter than 45 degrees to the annual ring orientation.(1) For good quality wood at 12 percent moisture content, the transmission time of 668 μs/m (203 µs/ft) in the radial direction, 800 μs/m (244 µs/ft) in the tangential direction, and 995 μs/m (303 µs/ft) in the 45 degrees to the annual ring orientation is expected (figure 1). Depending on the wood species, these values can vary ±10 percent.(1) For glulam (also known as glued laminated timber) members, the transmission time for each layer can vary depending on the ring orientation.

A. Travel paths.

B. Transmission time affected by the orientation of annual rings.

C. Typical transmission times in a glulam member.
Figure 1. Schematics and Graph. Transverse stress waves in timber. The annual ring orientation in the first top two layers is mainly radial, in the second top two layers—mainly 45 degrees, and in the third top two layers is mainly tangential.(1)
Decay
The presence of decay significantly affects the transmission time across wood grains, while it may not substantially affect the transmission time parallel to grains. A 30 percent increase in transmission time perpendicular to grain suggests 50 percent strength loss, and a 50 percent increase of transmission time perpendicular to grain indicates severe decay.(1) Transverse travel paths are best suited for finding decay. Parallel-to-grain travel paths can bypass regions of decay.
Moisture content
The stress wave transmission time perpendicular to the grain tends to decrease with moisture content below the fiber saturation point (FSP), approximately 30 percent, and it remains relatively constant for moisture levels higher than FSP (figure 2).(1) Depending on the moisture content and temperature of the wood during testing, adjustment factors can be applied to the transmission time results (table 1).(1)

Figure 2. Graph. Transmission time for transverse stress waves in red oak and southern pine.(1)
Table 1. Adjustment factor for transmission time of stress waves in Douglas-fir at various temperature and moisture contents [1].
| Moisture content (%) | Adjustment factor | |||
|---|---|---|---|---|
| –18 °C (0 °F) | 3 °C (38 °F) | 27 °C (80 °F) | 49 °C (120 °F) | |
| 1.8 | 0.94 | 0.95 | 0.97 | 0.98 |
| 3.9 | 0.95 | 0.96 | 0.98 | 0.99 |
| 7.2 | 0.93 | 0.98 | 1.00 | 1.01 |
| 12.8 | 0.97 | 0.99 | 1.00 | 1.01 |
| 16.5 | 0.99 | 1.01 | 1.03 | 1.05 |
| 23.7 | 1.05 | 1.07 | 1.09 | 1.14 |
| 27.2 | 1.07 | 1.10 | 1.12 | 1.17 |
Preservative treatment
The use of waterborne salts in treating wood does not significantly affect the transmission time of stress waves. However, depending on the penetration depth, oil-borne preservatives can increase the transmission time of stress waves up to 40 percent higher than that of the untreated wood.(1) The depth of preservative penetration in round poles generally varies between 37 and 61 mm (1.5 to 2.5 inch).(1) Table 2 shows an example of the estimated transmission times for poles of varying diameter as the penetration depth of preservatives varies.
Table 2. Estimated stress wave transmission time (µs) of round poles treated with oil-borne preservatives [1].
| Pole diameter (mm) | Stress wave transmission time (µs) for various penetration depths of preservatives | ||
|---|---|---|---|
| 37 mm | 61 mm | Full penetration | |
| 294 | 222 | 240 | 300 |
| 343 | 254 | 271 | 350 |
| 392 | 286 | 305 | 400 |
| 441 | 321 | 338 | 450 |
| 490 | 350 | 370 | 500 |
| 539 | 386 | 403 | 550 |
| 588 | 422 | 436 | 600 |
Data Acquisition
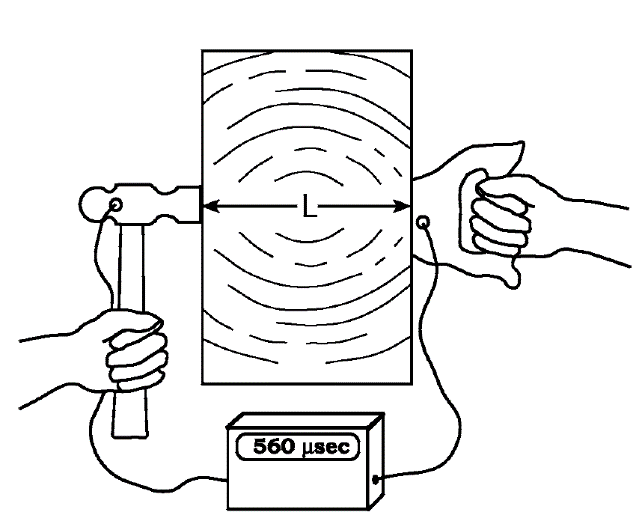
In stress wave timing tests, stress waves can be generated by striking a hammer, equipped with an accelerometer at its tip, to the side of a timber member and receiving the edge of the stress wave by another accelerometer attached to the other side of the member (figure 3). Because both accelerometers are connected to the stress timer, the time difference between generating and receiving the signal is recorded (figure 3).

Figure 3. Schematic. Illustration of the principle of stress wave timing tests.(1)
The use of stress wave timing for locating defects in timber structures is limited by accessing both sides of a member. This technique is particularly useful for assessing sawn lumber or glulam timber members with a thickness greater than or equal to 3.5 inches, where hammer sounding is not effective.(1) Depending on the frequency of excitation, the stress waves are referred to as sonic or ultrasonic. Sonic frequencies are between 20 Hz and 20 kHz, and ultrasonic frequencies are greater than 20 kHz. The application of a hammer and accelerometers for generating and receiving stress waves is mainly limited to the sonic frequencies. For generating and receiving ultrasonic waves, piezoelectric transducers should be used. Couplant is also required for attaching the transducers to the member when using ultrasonic measurement systems. Stress timing units generally produce comparable results when calibrated following the manufacturer’s recommendations.(1)
Data Processing
No data processing is required
Data Interpretation
In the physical principle section, several factors affecting the stress wave transmission time were discussed. For field applications, as a first step, a baseline transmission time (Tbaseline (µs)) using the wave transmission distance (WTD) for differentiating between sound versus potentially decayed wood should be defined. Transmission times smaller than Tbaseline (µs) indicate sound wood, while those larger than Tbaseline (µs) suggest potentially degraded members. WTD is a member thickness for the transverse wave transmission time measurements, and 1,000 (µs/m) can be used as a general baseline transmission time when WTD is expressed in meters. Similarly, 300 (µs/ft) is the general baseline transmission time when WTD is expressed in feet. A baseline transmission time can also be determined onsite by testing sound sections of the wood members.


Stress wave timing techniques should be used in areas with a high chance of deterioration, such as near bearings points and connections. The general baseline transmission time serves as a starting point in the inspection. Tests should be performed at various distances from the region of interest. The stress wave transmission times for sound wood show small variations. If substantial variations are observed in test results, the member should be specified as suspect.(1)
Advantages
Some advantages of stress wave timing include the following:
- The technique provides information about the physical and mechanical properties of wood because the wood elastic modulus is inversely proportional to the stress wave timing values.
- The technique is well developed and easy to use.
- The technique is appropriate for testing thick timber members where hammer sounding is not effective.
Limitations
Limitations of stress wave timing include the following:
- Training is required.
- Access to both sides of a wood member are required.
- Affects results due to defects other than decay, such as internal checks, cracks, and splits.
- Takes extra time since measurements need to be performed at multiple locations.
References
- White, R. H., and R. J. Ross, eds. 2014. Wood and Timber Condition Assessment Manual. 2nd ed. General Technical Report No. FPL-GTR-234. Madison, WI: U.S. Department of Agriculture, Forest Service, Forest Products Laboratory.


