Bridge - Radiography (RAD Void)
Target of Investigation
Radiography can be used for the following applications:
- Determining the positions, diameters, and condition of tendons and strands in post-tensioned and prestressed concrete girders.
- Detecting voids in cast-in-place, precast prestressed concrete girders.
- Assessing the grouting condition in the post-tensioning ducts.
Description
Concrete radiography is similar to radiography used to produce medical x rays. This method involves gaining information in a test object by subjecting it to high energy electromagnetic radiation. The propagation of radiation through the test object is captured on a special photographic film on the opposite side of the specimen to produce a photograph like representation of the internal structure of the concrete.
Physical Principle
The basic concept of gamma-ray radiography is illustrated in figure 1. A source transfers gamma-ray energy to a collimator through a guide tube by means of a telecontrol unit so that gamma rays impinge on the sample to be inspected. On the other side of the sample, an image plate registers the gamma-ray intensity traversing the sample. The lower the density of the material is, the higher the intensity of the gamma-ray energy that reaches the plate will be.
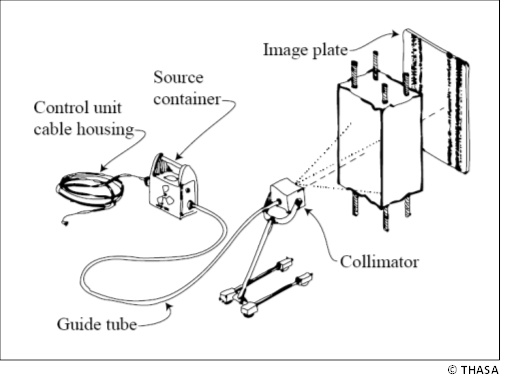
Since concrete is about 2.5 times denser than biological tissues, x rays used in medicine are not suitable for concrete members. For this reason, concrete radiography usually employs gamma-ray sources instead of x ray generators such as are used in medicine. Another advantage of gamma rays over x rays is gamma rays are emitted spontaneously by certain substances so electrical power is not required. An additional advantage of the 192Ir source is it can be housed in a small and relatively light container (~ 20 kg, 44lb).
The penetration of the gamma ray energy depends on its wavelength and energy level. The higher the source energy is, the greater the penetration of the gamma ray energy will be.
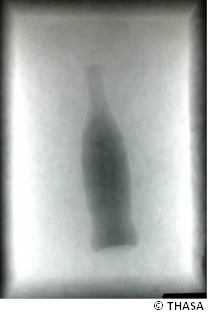
Figure 2 shows how voids are readily identified by using the radiographic method. An empty soda bottle embedded in a concrete block irradiated with gamma rays from a 192Ir source can be readily identified. The attenuation produced by voids (air) is negligible. Hence radiation transmitted through a void in the interior of a concrete sample will produce a “shadow” darker than the areas where radiation traverses the full thickness of the concrete sample.
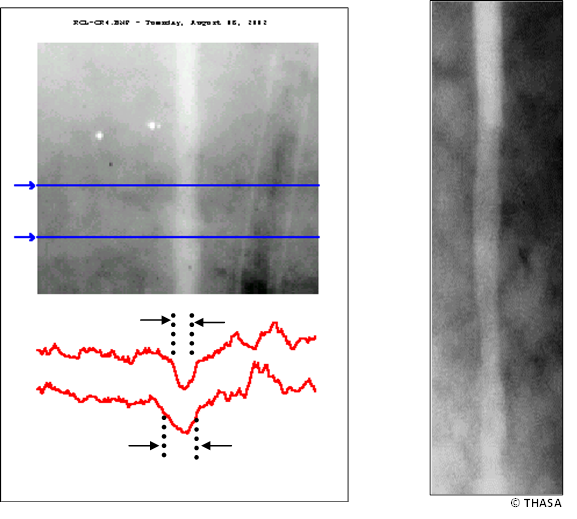
Since steel attenuates gamma ray energy more than concrete, steel elements such as rebars or strands embedded in a concrete sample project a lighter “shadow” on the image plate. A severely corroded rebar with a nonuniform cross section projects on the image plate non-uniformly (figure 3). These are radiographs of a slab (left) and a tank wall (right) obtained with a 192Ir source. The radiograph on the left hand side also shows an electrical conduit to the right of a corroded rebar. The red lines in the lower part display the photographic density along the “cuts,” indicated by the blue lines on the radiograph. They help visualize the reduced cross section due to corrosion.
Data Acquisition
Image plates, either conventional or more modern computed radiography (CR) image plates, record the gamma ray energy penetrated to the opposite side of a sample emitted from a 192Ir, 137Cs, or 60Co source. Conventional image plates must be developed after exposure, while CR image plates are converted into digitized images. The recording resolution of the CR image plates is about 5 times greater than that of conventional image plates. Plate size is usually 35 cm by 43 cm (14 inches by 17 inches).
Data Processing
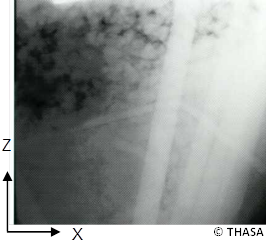
Figure 4 provides an example of a concrete wall with honeycombing. Visual inspection of the image plate is usually enough for detecting voids. A more detailed quantitative analysis can be carried out by examining the photographic density D(x,z) (i.e., the “gray” level) along different zi-lines.
Data Interpretation
Data interpretation for detecting voids is straightforward. Voids visually manifest as relatively darker areas in the radiograph of a concrete sample. However, other phenomena can result in relatively darker images. For instance, relative to the lighter shadow projected by reinforcing bars, the rest of the plate will appear darker. These situations are easily identified since the rebars project a well-defined shape. Another, more subtle effect is due to the intensity of the radiation falling onto the plate being not only a function of the attenuation of the materials it traverses but also of the inverse of the square of the gamma-ray path length d. If d is comparable to the dimensions (x,z) of the plate, the radiation intensity will be noticeably higher, producing a darker zone near the point at which d is smallest. That is the point (xo,zo) at which the line from the source perpendicular to the plate intersects the plate. In these cases, the photographic density D(x,z) on the plate will diminish regularly as (x,z) is farther from (xo,zo), exhibiting circles of equal photographic density.
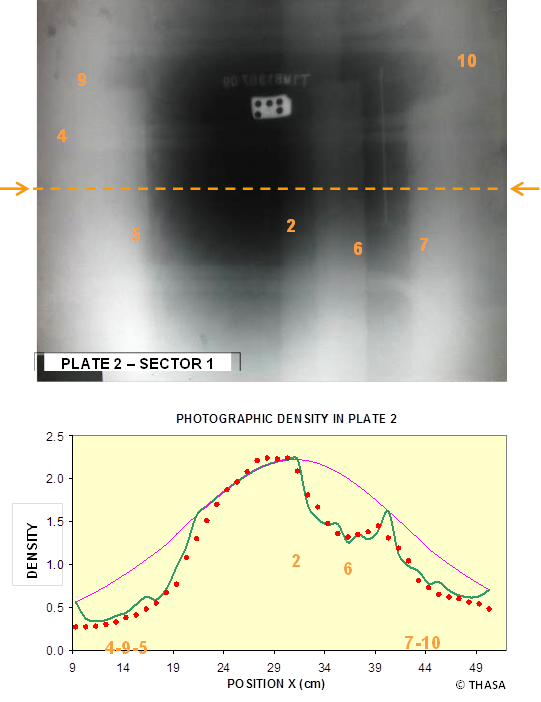
Figure 5 shows an example where these two effects combine to make identifying a void difficult. The radiograph in figure 5 corresponds to a concrete structure with several rebars (numbered vertical light gray bands) and a few stirrups (horizontal light gray lines). The small white rectangle with black dots, the label above it and the thin vertical metallic segment are external reference elements.
The source-to-plate distance in this measurement was only 22 cm. In order to determine whether the darker area at the center of the radiograph corresponds to a void or not, the photographic density along the dotted line was measured (red data points in the lower plot) and compared with the expected (calculated) photographic density.
The green and magenta lines on the graph in figure 5 are the calculated photographic densities with and without steel bars. The good agreement between the measured data and the calculations indicates that the dark areas extending from near the center towards the borders of the radiograph are not due to a void but rather to the variation of the gamma-ray path length among the different points
Advantages
- Produces “photographic” quality results and precise locating of reinforcement for condition assessment, void detection, and grout condition assessment.
- Small, portable source systems.
- Some source systems, such as those employed with 192Ir source, are easy to shield and Can be used in the field without interrupting traffic or causing disturbances to the general public.
Limitations
- Requires precautionary measures against gamma rays. Public exposure to radiations must always be below the limits set by the Nuclear Regulatory Commission and State regulations.
- Small, portable gamma ray source systems can only penetrate concrete elements of the thickness up to about 300 mm. Systems that can emit more energy must be used for thicker elements.
References
- Mariscotti, M.A.J., et. al., “Gamma-Ray Imaging for Void and Corrosion Assessment,” Concrete International, Vol. 31, No. 11, November 2009, pp.48-53.
- The data shown in this article are taken from studies carried out by THASA (www.thasa.com).


