


Tunnel - Phased-Array Ultrasonic Testing (PAUT)
Target of Investigation
Phased-array ultrasonic testing (PAUT) is a nondestructive evaluation technology that uses longitudinal wave (straight-beam) or shear wave (angled-beam) methods in steel members. This technology differs from conventional ultrasonic testing (UT) in that images of the results can be readily produced, and inspections can often be performed faster because the array covers more area than a single probe. PAUT can be applied to detect cracks, weld flaws, and section loss in steel members.
Description
PAUT is a nondestructive evaluation technology used to detect defects such as cracks and weld flaws in steel bridge and tunnel components. Figure 1 illustrates the use of PAUT to inspect a butt weld. The technology uses pulses of acoustic waves launched from a transducer. The waves propagate through the material and are reflected from discontinuities in the material. The transducer detects and analyzes the reflected waves. Both longitudinal and shear wave methods can be used. The longitudinal wave method (straight beam) is often used when access to the surfaces of the element under inspection is limited. The longitudinal wave method may also be used for measuring the thickness of a steel plate to detect section loss or for imaging back-surface corrosion pits. The shear wave method (angled beam) is commonly used to detect cracks and to inspect welds for flaws (figure 1).

Figure 1. Illustration. PAUT transducer mounted on an angled wedge and beam paths for inspecting a butt weld.
PAUT transducers comprise a number of sensing elements that generate and detect acoustic waves. Each element in the transducer launches acoustic waves that combine in the material being tested to allow the resulting ultrasonic beam to be steered in different directions or focused at different depths. The ability to steer the ultrasonic beam in different directions increases the volumetric coverage by a single transducer. This allows the technology to direct acoustic energy toward a particular location in the material and allows the wave beam to be scanned across the area where cracking is likely to initiate.
Physical Principle
PAUT identifies defects using the same physical principles as conventional UT, launching acoustic waves from a transducer and analyzing reflections from discontinuities and the physical boundaries of the material being tested. Conventional UT launches and receives waves from a single transducer. In contrast to conventional UT, PAUT uses multiple transducers to launch and receive acoustic waves. The physical principle of wave interference is used to combine waves launched from individual sensors to form a beam of acoustic energy that propagates in a desired direction. This allows the direction of the wave beam to be controlled and steered or focused at a desired distance from a PAUT transducer.
Wave interference occurs when two or more pulses of acoustic waves occupy the same space at the same point in time. Figure 2 illustrates the effect of constructive interference on the amplitude of an acoustic wave. If wave A and wave B occupy the same space and are in phase as shown in the figure, these individual waves will combine to form a wave with an amplitude equal to the sum of the two individual wave amplitudes. This phenomenon is known as constructive interference. PAUT utilizes this phenomenon by launching waves from several individual transducers at different points, so the interference between the individual waves results in a plane wave propagating in a certain direction (figure 3) within the material being tested.(1)

Figure 2. Graph. Constructive wave interference, where wave A is inphase with wave B, resulting in a combined wave (A + B).
Figure 3 illustrates the wave-interference phenomenon used to control the direction of an acoustic wave beam launched from a series of individual transducers. In the figure, the transducers are represented as point sources for acoustic waves. Acoustic waves are launched from each transducer via an excitation pulse. These excitation pulses are delayed in time (i.e., phased) to result in constructive interference of the individual waves within the material. In this manner, the acoustic wavefront can be steered or focused at a particular depth into the material by modifying the delay between the pulses from the individual sensors.

Figure 3. Illustration. Generation of a plane wave by sequential excitation of individual sensor elements.
Data Acquisition
The pulser circuitry in PAUT controls electronic pulses so that individual transducers are excited at different times to transmit acoustic waves into the material being tested. Receiver circuitry in the instrument applies electronic delays to each sensor to match the beam shape formed by the transducers. The received waveforms from each sensor may be combined into a single acoustic signal. This signal is digitized and stored in the computer.
Figure 4 is a photograph of a typical PAUT instrument being used in the field. The instrument contains the pulser–receiver circuitry and supporting software necessary to achieve beam forming, detect and store resulting waveforms, and produce different presentations of the data. A typical transducer array is attached to a refracting wedge that allows for angled-beam testing using shear waves.

Figure 4. Photo. PAUT instrument transducer used to launch angled beams.
Data Processing
Waveforms received by the sensors are digitized and stored in the PAUT instrument. The data are presented in a variety of formats for interpretation by the operator. Common presentations include A-scans, which display single waveforms, and sectorial scans, which display the results of multiple waveforms combined to form a color-coded image. The A-scan display (figure 5) presents waveform amplitude versus time, which is the typical data presentation for conventional UT.
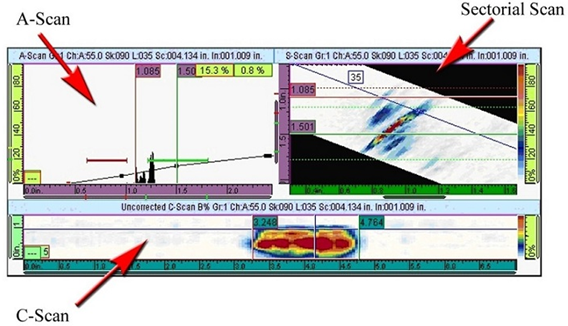
Figure 5. Composite graph. Data display from a PAUT instrument.
A sectorial scan is formed from the combination of numerous A-scans captured as the beam is steered at different angles. To form the sectorial scan, the amplitude in an A-scan is represented by a color-coded scale (shown to the right of the sectorial scan in figure 5). As the wave beam is steered through the desired angles, indications that cause highamplitude reflections will appear as two-dimensional features on the sectorial scan.
Data may also be presented in a C-scan format when a two-dimensional scanner is used to scan the transducer across the surface of the material being tested. The C-scan format presents the linear ordinate of the transducer on the x-axis and the color-coded amplitude of the A-scans across the transducer aperture on the vertical axis. A spatial image showing areas of section loss and/or deep corrosion pits is produced.
Data Interpretation
PAUT data are interpreted in the same manner as conventional UT data. The amplitude of reflected waves is compared with a standard to assess whether a given indication is acceptable. If a linear encoder is used during the data collection process, the length of indications may be estimated based on the data collected and stored.
Advantages
Advantages of PAUT include the following:
- Detects both surface and subsurface flaws.
- Assesses areas that are inaccessible for visual inspection.
- Has improved volumetric coverage and greater flexibility for testing complex geometries.
- Provides complete data records stored for future reference.
Limitations
Limitations of PAUT include the following:
- Requires surface preparation.
- Requires well-trained and experienced operators.
- Has increased cost of equipment as compared to conventional UT.
References
- Olympus NDT, Inc. (2007). Advances in Phased Array Ultrasonic Technology Applications, Olympus, Waltham, MA.