Underground Utilities - Multichannel Analysis of Surface Waves (MASW) — Concrete
Target of Investigation
Multichannel analysis of surface waves (MASW) is a nondestructive evaluation (NDE) technique that involves generating cross-sectional, inverted shear images of the ground from surface waves propagated between an active seismic source and geophone receivers at predetermined offsets.(1,2) MASW is traditionally used for bedrock and soil profiling but has recently been applied to the detection of buried utilities. Although the MASW technique still requires more testing before commercial application for locating buried utilities, there is promise for reliable application.
Description
Analyzing seismic surface waves is advantageous because they are relatively large in amplitude, which can provide ideal signal-to-noise ratios in areas with elevated levels of mechanical or acoustic noise. Spectral analysis of surface waves (SASW) may be useful in various situations to support electromagnetic recordings or substituted when electromagnetic technologies are not effective (e.g., loose soil, nonconductive materials, or physical obstacles), especially because seismic waves remain unaffected by wet soil conditions and conductivity issues. Conventional SASW, however, is limited by multiple factors, including phase unwrapping errors, inefficient data filtering, and failure to classify multiple modes.(3) Unlike the two-channel SASW method, MASW implements a two-dimensional (2D) wavefield transformation to produce images of subsurface shear-wave velocity. (See references 3, 4, 5, 6, and 7.) Using surface-wave energy between 1 and 30 Hz on multiple channels (minimum of 24 geophones), MASW generates surface waves using an active (sledgehammer) or passive (traffic, tidal motions, thunder) source.(8) For shallower studies, such as utility detection, an active source is ideal as it images objects at depths less than 100 ft.
Physical Principle
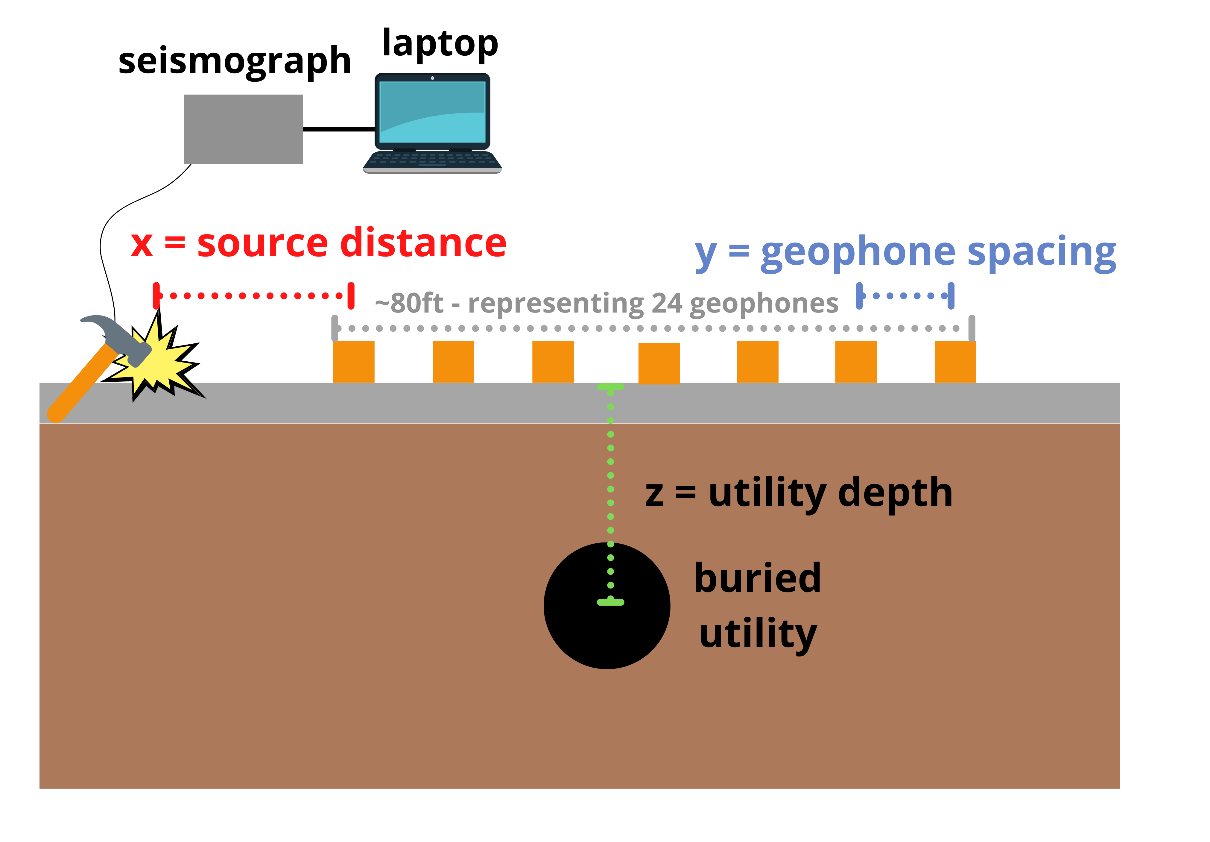
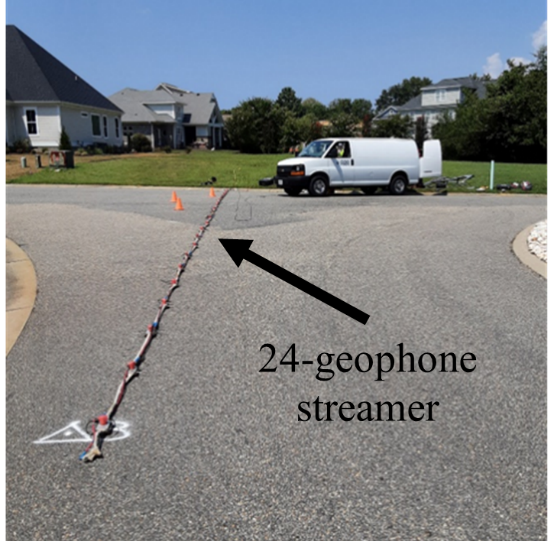
MASW leverages the dispersive characteristic of Rayleigh waves (a type of surface wave that travels near the surface of solids) in an inhomogeneous medium.(9) As an active source method, surface waves are generated by dynamic sources, such as hammers, weight drops, vibroseis, and bulldozers, at a variety of frequencies. MASW is ideal for measuring shear‑wave velocity with depth through inversion of dispersion curves.(10) This method can be applied to both bare and paved surfaces, is ideal for depths up to 100 ft, and is not limited by soil type. In principle, MASW can detect polyvinyl chloride (PVC), concrete, and metal/steel utilities; however, this summary only addresses data collected detecting PVC utilities. Sensor and source setup are shown in figure 1 and figure 2.
By exploiting the dispersion of surface waves through pits, trenches, or buried utilities compared to the surrounding medium, MASW software can locate localized zones of subsurface anomalies, including pipes. For example, one utility software package generates a shear velocity (Vs) profile through dispersion-curve analysis from a multichannel record and then an inversion process.(12) Miller et al.(13) combined MASW with a common middle-point data acquisition to delineate vertical and horizontal variations in subsurface materials.
Data Acquisition
Fieldwork Preparation
To acquire data for MASW processing requires a land streamer (i.e., inline array) with 24 vertical-component geophones, a 24-channel seismic recorder, and an active source (e.g., hammer and strike plate). The following walk-through of a field deployment of MASW equipment in Carrollton, VA, is provided as an example.
The field team used an MASW system consisting of a land streamer (i.e., inline array) with 24 vertical-component geophones and a 24-channel seismic recorder. The individual geophones in the array are coupled to the ground using spiked lines or weights to allow for easier data collection, or using streamer lines, with 1-ft geophone spacing for spiked lines and 3.3-ft for streamer lines. The MASW rental system also included a laptop computer to control the seismograph and data collection.
Field Data Collection
MASW data collection uses a strategy known as “shoot-through roll-along” acquisition that produces multiple seismic records (collections of time histories) with the same source-to-receiver offsets and geophone array lengths. Each acquisition layout is designed for a specific investigation depth to maximize the accuracy of the final subsurface images. The ideal approach is a shoot-through method that involves moving the source through the geophone array, which is also known as the roll-along method (figure 3).
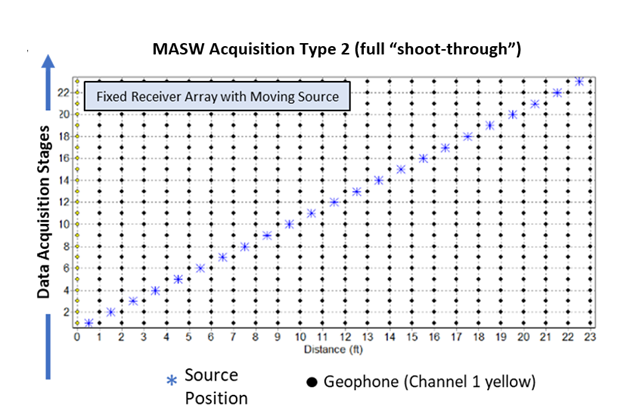
To induce ground motion, a field crew should employ a 1.5-lb and a 4-lb double-ended metal hammer to strike metal plates on the ground. These lightweight sources are sufficient for shallow targets of interest (under approximately 13 ft). The data records should be stacked over three hammer swings per source location to increase the data signal-to-noise ratio. Field personnel should design the layout at each setup to detect a primary target near the middle of the geophone array and a secondary target (if one exists) closer to the end of the array.
Data Processing and Interpretation
Multiple well-tested software packages are available to process and analyze MASW data, some of which will read in SEG-2 files (an open data standard developed by the Society of Exploration Geophysicists (SEG)), and then an analyst manually selects a one-dimensional dispersion curve for each geophone location.(14) Through dispersion-curve analysis and an inversion process, the software generates a 2D shear-velocity map. The 2D Vs profile can highlight anomalous zones that may enable a user to detect buried utilities.
For example, a field team conducted five or more layouts at each of three testing locations in Carrollton, VA, (Spring Hill, Settlers Ridge, and Windsong Way) using the streamer and/or spiked geophone line on targets of various diameter, material, and estimated depth. The team did not apply MASW in this field experiment to detecting concrete utilities, and therefore, what follows are two successful examples of PVC utility detection.
MASW Example Results—Settlers Ridge Setup Number 11 (SR11)
At the SR11 site, the field team successfully used the partial shoot-through approach for data‑acquisition. The project analyst used a commercial software package created by a research and development company to process MASW data by using 12 geophone traces at a time and sweeping through the waveform dispersion analysis. MASW theory dictates that buried utilities should appear as low-velocity zones in the 2D shear‑wave velocity images. The SR11 results in figure 4 show two low-velocity zones that correlate well with the expected depths of the water and sewer pipes.
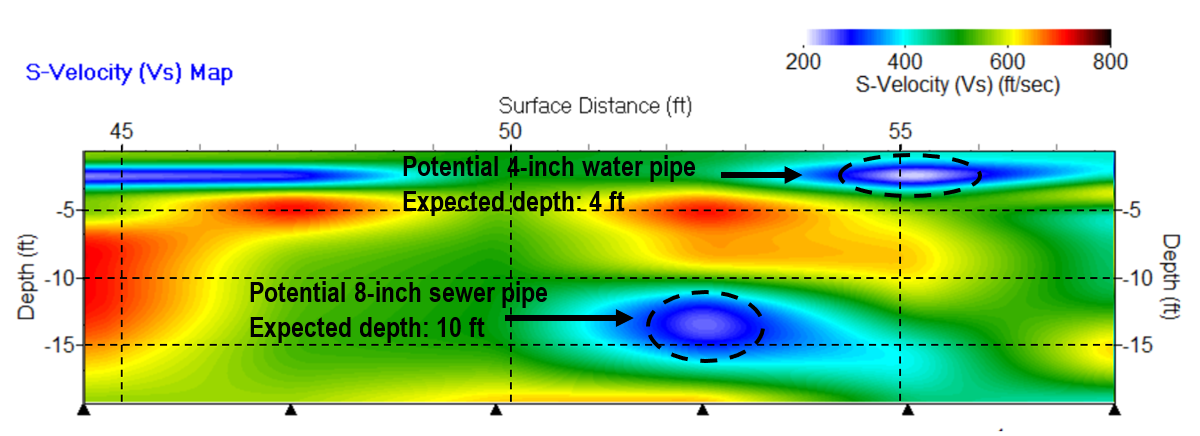
At the SR11 site, an 8-inch PVC sewer line is located at a depth of 10 ft, but the 2D MASW image places it closer to 13 ft. The site maps indicate a 4-inch PVC water pipe at a depth of 4 ft; MASW located it closer to a 3-ft depth. These results indicate the usefulness of MASW to detect and approximately locate utility lines, although the pipe diameter is not well constrained using standard processing techniques.
MASW Example Results—Settlers Ridge Setup Number 7 (SR7)
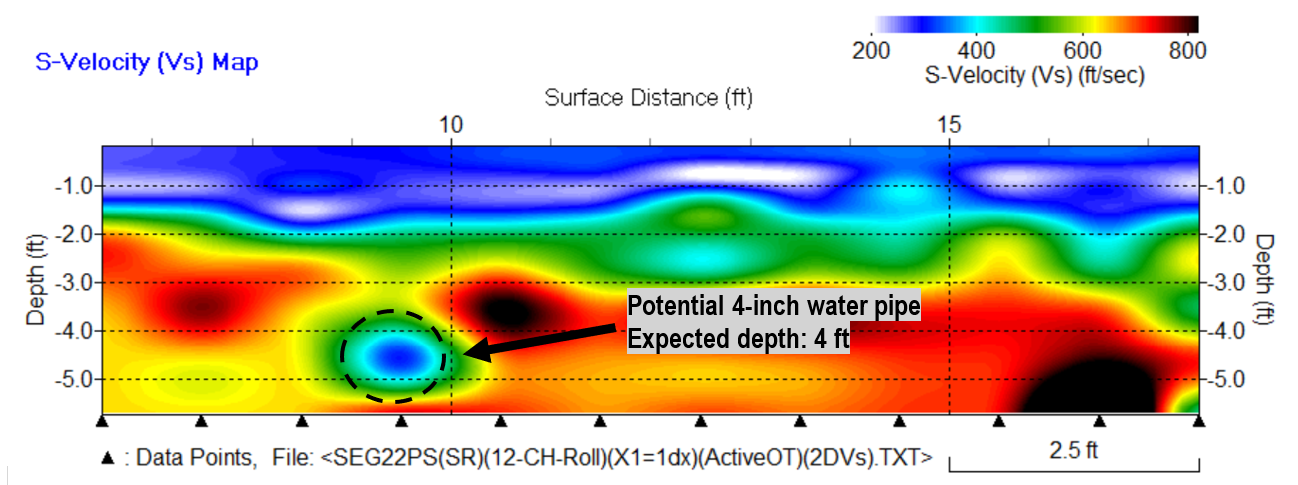
At the SR7 site, the field team used a full shoot-through approach with a 1-ft geophone spacing to detect a shallow target. The same MASW processing procedure used for SR11 was applied to the SR7 data. The analyst manually selected a full set of dispersion curves and performed inversion to generate the final VS profile shown in figure 4. For the SR7 setup, the field team identified a low-velocity zone near the location and depth expected of the 4-inch water pipe (figure 5).
Summary of MASW Field Tests
The results of the field tests provide evidence that MASW technology can detect and approximately locate utility lines, particularly with the right acquisition strategies and streamer array parameters. Specifically, using the shoot-through MASW acquisition strategies led to clear utility detections at SR11 and SR7, including 4-inch water lines at 3.3- and 4-ft depths, and an 8-inch sewer line at a depth of 10 ft. Geophone spacing and the appropriate source weights are key parameters for the successful application of MASW to detect buried utilities.
Although the MASW method can successfully image the locations and depths of buried utilities, it is unable to resolve pipe diameters with confidence. The MASW technology is still not suitable as a stand-alone detection method for underground utilities, but it can be used as an auxiliary method to increase confidence in the results from other NDE technologies or as an alternative method when ground-penetrating radar or other methods are unsuccessful.
Advantages
- Not limited by pipe conductivity or soft soil.
- Potential to identify plastic, concrete, and metal/steel targets under grass and pavement.
- Ideal for shallow targets (12–96 inches below surface).
Limitations
- Moderate depth precision (+/− 15 percent).
- Slower data acquisition and multigeophone array.
- Improved data-processing needed prior to commercial implementation.
References
- Datta, S., and S. Sarkar. 2016. “A Review on Different Pipeline Fault Detection Methods.” Journal of Loss Prevention in the Process Industries 41: 97–106.
- Hawari, A., M. Khader, W. Hirzallah, T. Zayed, and O. Moselhi. 2017. “Integrated Sensing Technologies for Detection and Location of Leaks in Water Distribution Networks.” Water Science and Technology: Water Supply 17, no. 6: 1589–1601.
- Lin, C. P., C. H. Lin, and C. J. Chien. 2017. “Dispersion Analysis of Surface Wave Testing—SASW vs. MASW.” Journal of Applied Geophysics 143: 223–230.
- Park, C. B., R. D. Miller, J. Xia, and Kansas Geological Survey. 1996. “Multi-Channel Analysis of Surface Waves Using Vibroseis (MASWV).” SEG Technical Program Expanded Abstracts 68–71.
- Xia, J., R. D. Miller, C. B. Park, J. Hunter, D. Laflen, R. Good, and C. Gratton. 1998. Comparison of Shear Wave Velocities from MASW Technique and Borehole Measurements in Unconsolidated Sediments of the Fraser River Delta. Open-File Report No. 98–58. Lawrence, KS: Kansas Geological Survey.
- Park, C. B., R. D. Miller, and J. Xia. 1999. “Multichannel Analysis of Surface Waves.” Geophysics 64, no. 3: 800–808.
- Xia, J., R. D. Miller, and C. B. Park. 1999. “Estimation of Near-Surface Shear-Wave Velocity by Inversion of Rayleigh Waves.” Geophysics 64, no. 3: 691–700.
- Park, C. B., R. D. Miller, J. Xia, and J. Ivanov. 2007. “Multichannel Analysis of Surface Waves (MASW)—Active and Passive Methods.” The Leading Edge 26, no. 1: 60–64.
- Fernández, J., L. Hermanns, A. Fraile, E. Alarcón, and I. Del Rey. 2011. “Spectral Analysis Surface Waves Method in Ground Characterization.” Procedia Engineering 10: 3202–3207.
- Badsar, S., M. Schevenels, W. Haegeman, and G. Degrande. 2010. “Determination of the Material Damping Ratio in the Soil from SASW Tests Using the Half-Power Bandwidth Method.” Geophysical Journal International 182: 1493–1508.
- Reiter, D., V. Napoli, J. Cohen, S. Boone, P. Moseley, A. Alhasan, and J. Salerno. 2023. Availability, Feasibility, and Reliability of Available Nondestructive Evaluation (NDE) Technologies for Detecting and Locating Buried Utilities. Report No. FHWA-HRT-23-037. Washington, DC: Federal Highway Administration.
- Kansas Geological Survey. 2022. SurfSeis MASW (software). http://www.kgs.ku.edu/software/surfseis/index.html, last accessed February 22, 2023.
- Miller, R. D., C. B. Park, J. M. Ivanov, J. Xia, D. R. Laflen, C. Gratton, and R. Overton. 2000. MASW to Investigate Anomalous Near-Surface Materials at the Indian Refinery in Lawrenceville, Illinois. Open-File Report No. 2000-4. Lawrence, KS: Kansas Geological Survey.
- Pullan, S. E. 1990. “Recommended Standard for Seismic (Radar) Files in the Personal Computer Environment.” Geophysics 55, no. 9: 1260–1271.
- Jalinoos, F. 2022. TechBrief: Availability, Feasibility, and Reliability of Available Nondestructive Evaluation Technologies for Detecting and Locating Buried Utilities. FHWA‑HRT‑22‑111. Washington, DC: Federal Highway Administration.
Bibliography
Hutchinson, P. J. and M. H. Beird. 2016. “3D Mapping with MASW.” The Leading Edge 35,no.4: 350–352.
Jaw, S. W., and M. Hashim. 2013. “Locational Accuracy of Underground Utility Mapping Using Ground Penetrating Radar.” Tunnelling and Underground Space Technology 35: 20–29.
Park, Y. J., K. H. Kim, S. B. Cho, D. W. Yoo, D. G. Youn, and Y. K. Jeong. 2004. “Buried Small Objects Detected by UWB GPR.” IEEE Aerospace and Electronic Systems Magazine 19, no. 10: 3–6.
Park, Y. J., K. H. Kim, S. B. Cho, D. W. Yoo, D. G. Youn, and Y. K. Jeong. 2003. “Development of a UWB GPR System for Detecting Small Objects Buried Under Ground.” Proceedings of the Institute of Electrical and Electronics Engineers (IEEE) Conference on Ultra Wideband Systems and Technologies. Reston, VA: IEEE.
Plewes, L. A. and B. Hubbard, 2001. “A Review of the Use of Radio-Echo Sounding in Glaciology.” Progress in Physical Geography 25, no.2: 203–236.
SESAME. 2004. Guidelines for the Implementation of the H/V Spectral Ratio Technique on Ambient Vibrations Measurements, Processing, and Interpretation. Report No. EVG10CT-2000-00026 SESAME. Brussels, Belgium: European Commission. http://sesame.geopsy.org/Papers/HV_User_Guidelines.pdf, last accessed February 23, 2023.


