Bridge - Linear Polarization (LPR)
Target of Investigation
LPR can be used in tandem with other corrosion assessment techniques such as HCP, which identifies corrosion activity, or ER, which describes corrosive environment, to provide a more comprehensive assessment of corrosion. The corrosion rates can be used to predict the remaining service life of a tested structure. However, as the test results only indicate the instantaneous rates of steel bar corrosion, using the obtained corrosion rates for such purpose is limited and still of controversy.
Description
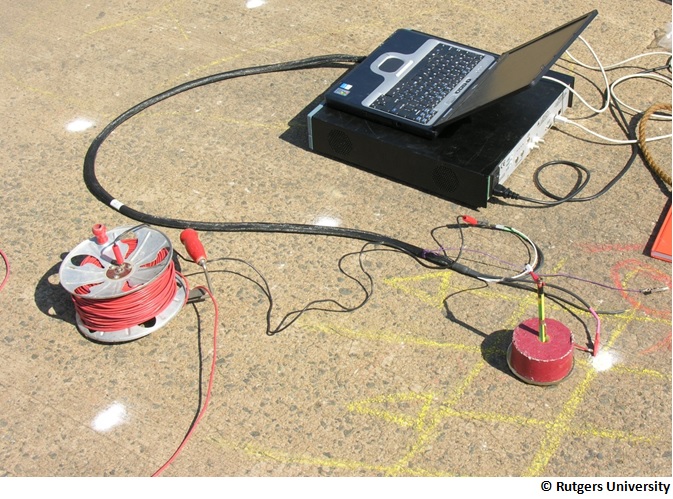
When the passive oxide film that protects the steel is broken by an unfavorable environment in the concrete, the potential difference produces a current within a micro electrolytic cell. At the anode of this cell, iron atoms transform to ferrous ions, move into the surrounding concrete, and leave their free electrons on the steel bar. When the corrosion continues, these free electrons accumulate and give the rebar negative charge. The HCP method, based on detecting these negative charges, finds regions with likely corrosion activities, and the LPR technique helps identify the rate of rebar corrosion. Figure 1 shows the LPR method.

Physical Principle
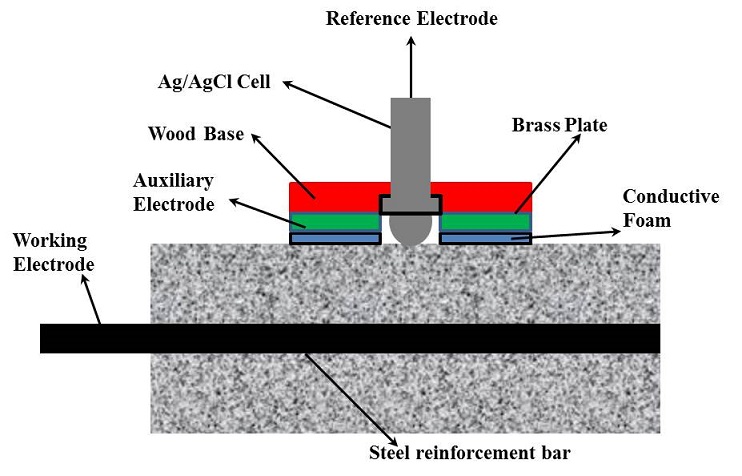
The LPR technique is a method for evaluating instantaneous rate of rebar corrosion.(1) The technique is noninvasive but requires a localized damage to the concrete cover to enable an electrical connection to be made to the reinforcing steel. The principal of LPR is based on disturbing the corrosion equilibrium on the surface of steel reinforcing bars by introducing a small perturbative electrical signal using a surface counter electrode (figure 2). Monitoring the relationship between electrochemical potential and current generated between electrically charged electrodes under the test allows the calculation of the corrosion rate. The data provides the instantaneous rate of the steel reinforcement corrosion at the test location, giving more detailed information than a simple HCP measurement.
The term “polarization” refers to the change in the open-circuit potential as a result of the passage of current produced by the auxiliary electrode. For a small perturbation of the open circuit potential, there is a linear relationship between the change in voltage and the change in applied current per unit area of electrodes, and this ratio is called the polarization resistance.
The LPR technique may be used for accurate measurement of corrosion rates. It is very sensitive, so very low rates can be identified. Used with HCP, the technique provides complete knowledge about the state of corrosion activity.

Data Acquisition
The first step in the LPR data collection is to expose the steel reinforcement and makepositive electrical contact (tap). After confirming the continuity of the electrical conductivity between the contact point and reinforcement in the concrete area being tested, the LRP test can be performed using either manual or automated methods.
For the manual method, readings are collected using a three-electrode polarization resistance (3LP) system, and the reinforcement is polarized through manual operations. First, the electrical potential is monitored until it is stable, with potential variations of no more than +/- 5 mV per minute. If readings are not stable, it may indicate inadequate moisture or interference by an external electrical source, which should be evaluated and rectified before proceeding. Once a stable potential is established, the electrical potential value is recorded. The system is set to report a relative potential, versus the open-circuit potential, and the meter is zeroed. Electrical current is then applied to polarize the reinforcement at a slow, steady rate, such that the offset potential reaches +4, +8, and +12 mV from the open-circuit potential. At each noted potential increment, the corresponding current required to achieve that offset is recorded. The complete polarization procedure should take no longer than 2 minutes. Once complete, the current is removed, and the reinforcement is allowed to de-polarize. Within 3 minutes, the potential should return to the open-circuit potential. If it does not, then the associated “drift” in open-circuit potential will influence the measured corrosion rate, so the measurement should be re-taken. A period of 5 to 10 minutes should pass before repeating readings to ensure adequate de-polarization.
Some field instruments and laboratory potentiostats can be programmed (or are pre-programmed) to perform the polarization process automatically. Such systems should be programmed to linearly perturb the potential to at least +12 mV and no more than +20 mV from open-circuit potential at a rate of 10 mV per minute. It is preferred that the system monitors and collects the open-circuit potential, recording potentials in 1 second intervals for at least 1 minute before and after the test. Some devices are equipped with a “guard ring” electrode that induces a separate current into the electrode that surrounds and attempts to “contain” the primary counter electrode current into a specified polarization area. Such instruments are known to give significantly different corrosion rate values than the methods outlined above and are believed to underestimate the actual corrosion rate.
Data Processing
Data processing of LPR test involves three main steps:
Step 1: Calculate the area (A) of the rebar affected (perturbed) by the measurement.
Step 2: Calculate polarization resistance (Rp) by dividing the measured potential (resulted from current change) by small current step (used as the perturbative signal).
Step 3: Calculate the corrosion rate (icorr) as shown in figure 3.

Where:
B = a potential constant.(2)
Rp = polarization resistance.
A = area of steel being perturbed.
Typical values of corrosion rates from LPR measurements are presented in table 1.
Table 1. Typical Corrosion Rates from LPR Measurements.(3)
| Corrosion Classification | Corrosion Current Density icorr | Corrosion Penetration Rate |
| Passive/Very Low | Up to 0.2 μA/cm2 | Up to 2 μm/year |
| Low/Moderate | 0.2 μA/cm2 to 0.5 μA/cm2 | 2 μm/year to 6 μm/year |
| Moderate/High | 0.5 μA/cm2 to 1.0 μA/cm2 | 6 μm/year 12 μm/year |
| Very High | > 1.0 μA/cm2 | > 12 μm/year |
Data Interpretation
Data interpretation consists of generating a contour map of the measured corrosion rate to report the spatial distribution of the state of corrosion activity.
Advantages
- Ability to make a qualitative estimate of section loss.
- Rapid testing of a large number of surface areas.
- Automated testing of concrete girders allows for testing with little to no interruption to traffic.
Limitations
- Requires a connection to the embedded reinforcement and is therefore a semi-nondestructive technique.
- Requires reinforcement to be electrically connected for LPR to work with a single connection to the reinforcement.
- Not applicable to epoxy-coated bars.
- No standards for interpretating test results.
- Concrete surface has to be smooth, uncracked, free of impermeable coating, and free of visible moisture.
- Requires experienced personnel for testing and data processing.
- Time consuming and labor intensive.
- The instantaneous corrosion rate is subject to fluctuation over time.
References
- Millard, S.G., & DME Consortium, DTI (2003) Good Practice Guide No. 132, Concrete, “Measuring the Corrosion Rate of Reinforced Concrete Using Linear Polarisation Resistance,” pp. 36–38, 2003.
- Stern M., & Geary A., “Electrochemical Polarization: A Theoretical Analysis of the Shape of Polarization Curves,” Journal of the Electrochemical Society, Vol. 104, pp. 56–63, January 1957.
- Andrade C., & Alonso C., “Corrosion Rate Monitoring in the Laboratory and On‑Site,” Construction and Building Materials, Vol. 10, No. 5, pp. 315–328, 1996.


