Bridge - Infrared Thermography (IT)
Target of Investigation
IR thermography is an NDE method used for the following applications:
- Detection of delamination, overlay debonding, and voids in concrete decks and tunnels.
- Detection of delamination in concrete pavements and quality control during asphalt paving.
- Detection of voids in shallow tendon ducts (thin concrete cover).
- Detection of near surface cracks and segregation/honeycombing in concrete elements.(1)
Description
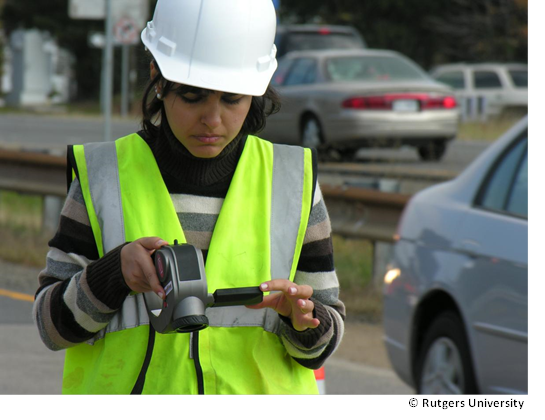
IR thermography is an NDE technology used in many engineering applications to detect defects and deterioration, thermal and gas leaks, and so on. It has been used to detect defects in transportation infrastructures since the 1980s. This primarily included detection of delamination, voids, and similar defects and anomalies. The detection of defects by IR thermography is based on measuring temperature variations on the surface of an element as a result of differences in thermal conductivity and specific heat capacity of materials and thermal conduction discontinuities within the element. Maps of surface temperature (thermograms) are generated from images taken by infrared cameras (figure 1) that measure the infrared radiation emitted by a body and converted into an electrical signal. The wavelengths of interest are between 0.7 and14 µm. In most cases, a qualitative data analysis is done even though a number of programs were developed to automatically detect and interpret different types of defects or anomalies.
Physical Principle
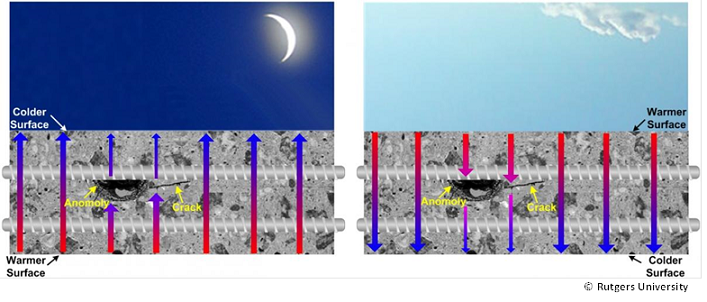
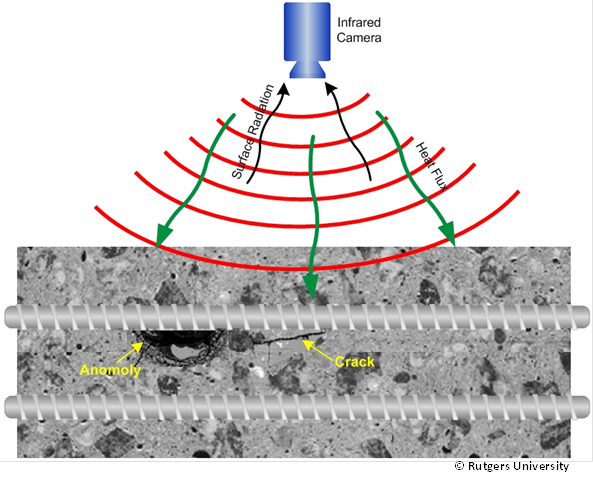
IR thermography is based on detecting and measuring radiation in the wavelength range of 0.7 to 14 µm of the electromagnetic spectrum. Thermal radiation (emissivity) of materials is controlled by three main properties that influence the heat flow and distribution within a material: thermal conductivity, specific heat capacity, and mass density. Infrared cameras measure the thermal radiation emitted by a body to capture the regions with temperature differences. Figures 2 and 3 illustrate the physical principle of IR thermography in detecting defects in concrete decks. When solar or other natural radiation, as in the case of passive thermography, heats up the deck, the deck and all the objects in the deck emit some energy back, sometimes following different thermal paths (figure 2). Delamination, voids, and other anomalies, which in some cases may be filled with water, have different thermal conductivity and thermal capacity than the surrounding concrete. Therefore, the area on top of a delaminated area may heat up faster after the sunrise and cool down more quickly during and after the sunset compared to sound concrete. As a result, those areas may develop surface temperatures up to several degrees centigrade higher than the surrounding sound concrete areas when ambient conditions are favorable.(2) In the case of active thermography, the surface of the object is heated by a heater to create thermal contrasts between the defects of interest and the element (figure 3).
Data Acquisition
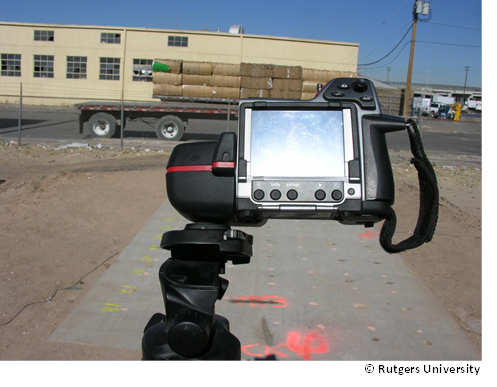
Depending on the heating source, infrared thermography surveys are described as passive or active. Passive IR thermography is more commonly used since it is uses natural heating sources. In most cases, the sun is the heating source and, thus, structures directly exposed to sun heating (for example, bridge decks) are good candidates for passive IR thermography. The best time for an IR survey is between 5 and 9 hours after sunrise or at about the same number of hours after sunset. Experiments have shown the highest temperature contrasts are achieved during those periods. Other environmental factors can affect the effectiveness of an IR thermography survey, like cloudiness or precipitation.(3) The survey is conducted using IR cameras (figure 4). Modern cameras simultaneously take IR and high resolution video images. The color coded IR images, called thermograms, represent temperature gradients. Those are evaluated for cold or hot spots, which in many cases represent and are interpreted as defects or anomalies. On the other hand, active or impulse-thermography utilizes radiant and fan heaters, or flash or halogen lamps, thus eliminating dependence on the heat from sun or other natural heating source. While active thermography may produce better controlled and higher quality results, it is used only in evaluations of smaller elements.
For complete data collection procedures, refer to ASTM D 4788-03 (2013), Standard Test Method for Detecting Delaminations in Bridge Decks Using Infrared Thermography.(4)
Data Processing
An IR camera records a series of geo-referenced, still, infrared images or an IR video. Images are automatically sequenced together to form a plan view of the surveyed surface or an element. In this manner, and in combination with video images, spatial information is maintained for all images, and potential defects and anomalies can be located on the element surface.
Data Interpretation
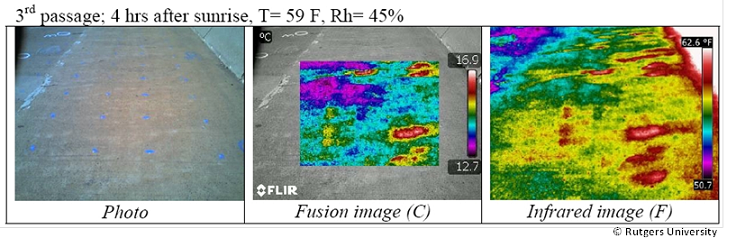
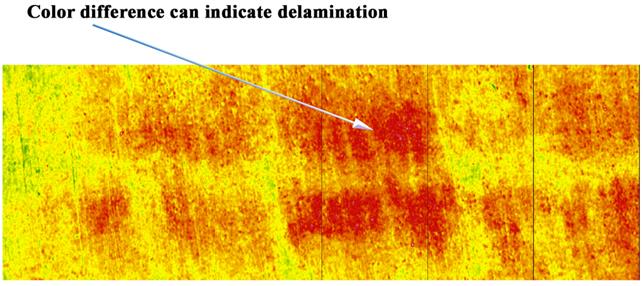
The infrared image or thermogram can be superimposed on the video image of the deck to enhance interpretation. As illustrated in figure 5, superimposing the thermograph on the video image can help interpret the deck condition by correlating the visible damage, such as spalling on the surface, to thermal anomalies. For example, high temperature areas in figure 5 indicate presence of inhomogeneities; for a bridge deck, this likely means delamination. Delaminated areas manifest themselves as hot spots during the warming hours of the day (figure 6) and as cold spots during the evening and night cooling hours.
Advantages
- Fast technique when a vehicle-mounted IR camera system is used. Moderately fast technique when the survey is done manually.
- Requires little to no traffic control when using vehicle mounted system.
- More cost effective than other NDE systems in detecting similar type defects.
- Fast and easy equipment setup.
- Moderate to high accuracy when data collected is at the right time.
Limitations
- Often difficult to select the optimal conditions needed to detect a defect.
- Changes in surface conditions (water, oil stains, or debris) can cause problems with data.
- Does not provide information about the depth of the flaw.
- Difficult to detect flaws deeper than 4 to 5 inches in concrete elements.
References
- Maierhofer, C., et al., “Application of Impulse-Thermography for Non-Destructive Assessment of Concrete Structures,” Cement and Concrete Composites, Vol. 28, 2006, pp. 393–401.
- Gucunski, N., et al., Nondestructive Testing to Identify Concrete Bridge Deck Deterioration, Report S2- R06A-RR-1, SHRP2 Renewal Research, Transportation Research Board, 2013.
- Washer, G., et al., “Environmental Factors for the Thermographic Inspection of Highway Bridges,” International Conference of NDE/NDT for Highway and Bridges, Structural Materials Technology (SMT) Proceedings Oakland, CA, September 9-12, 2008.
- ASTM D 4788-03(2013), Standard Test Method for Detecting Delaminations in Bridge Decks Using Infrared Thermography, ASTM International, West Conshohocken, PA, 2013.


