Bridge - Impact Echo (IE)
Target of Investigation
Primary applications of IE include the following:
- Detecting and characterizing delamination on reinforced concrete elements.
- Characterization of grouting in tendon ducts.
- Debonding detection on decks with overlays.
- Measuring the thickness of slabs and walls.
IE has also been used with limited success in the following applications:
- Evaluating the depth and primary direction of surface opening cracks (vertical cracks in bridge decks).
- Detecting ducts and voids in ducts, as long as the diameter to concrete cover ratio is above a certain threshold, roughly one third. While horizontal position can be well-defined, it is difficult to accurately define the concrete cover thickness. Detection of ducts requires a scanning approach and in most case requires a higher level expertise.
Description
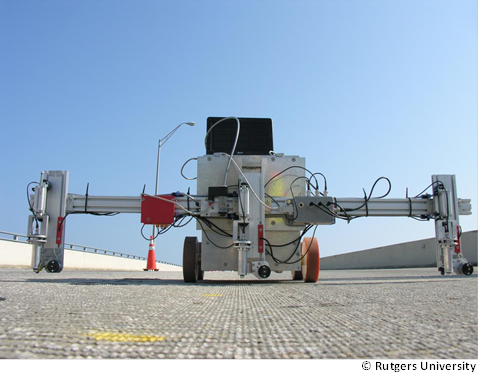
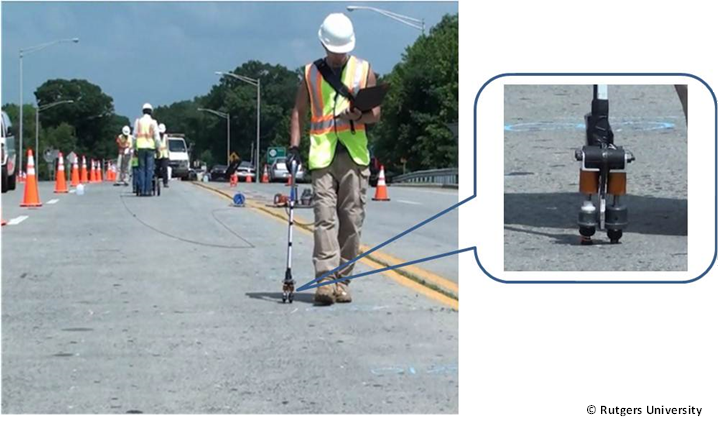
The IE method is a seismic or stress-wave based method used to detect defects in concrete, primarily delamination. The objective of the IE survey is to detect and characterize wave reflectors or “resonators” in a concrete bridge deck or other structural elements. IE devices can have multiple IE probes (figure 1) or a single IE probe (figure 2), each consisting of an impactor and a sensor.
Physical Principle
The impact echo (IE) test is conducted using an impact source and a nearby receiver. The impact generates waves that propagate within the solid material. Waves are reflected by internal defects (difference in acoustic impedance) or external boundaries. When the reflected waves, or echoes, return to the surface, they produce displacements. The transient response time of the solid structure is measured with a sensor mounted on the surface close to the impact source. The multiple reflected waves monitored by the sensor manifest as resonance conditions in the frequency domain analyses.
Data Acquisition
For a complete data collection procedure, refer to ASTM C1383, Test Method for Measurement P-Wave Speed and the Thickness of Concrete Plates Using the Impact-Echo Method.(2)
The deck surface to be surveyed needs to be cleaned of debris before IE testing. The survey should be conducted on the densest grid possible (a 2-ft by 2-ft grid is recommended). Mark the grid using a washable paint or chalk. Data collection can conducted using a variety of devices, each providing a different level of accuracy, speed, and automation.
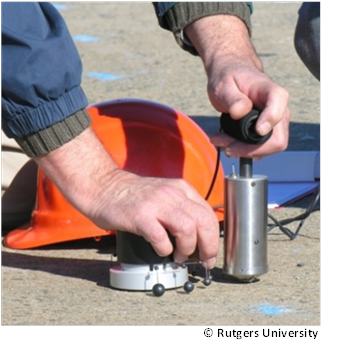
The equipment used for IE testing consists of an impactor (figure 3) and a sensor recording the response of the deck or other structure.(2) The impactor should be selected carefully to provide enough energy in the frequency range of interest. Some impactors are equipped with a sensor to measure the characteristics of the impact. The following are the wavelength frequency requirements:
- It should be shorter that the lateral size of the defect.
- It should be shorter than twice the depth of the defect to be detected.
A simple rule used in the definition of the maximum useful frequency is the inverse of the impact duration (contact time), which is typically from 20 to 100 µs. Many IE systems utilize steel balls of different sizes as impact sources, where the center and maximum frequencies are inversely proportional to the ball diameter.
Data Processing
The amplitude spectrum obtained from the fast Fourier transform analysis of the time signal will show dominant peaks at certain frequencies, which can be interpreted to assess the deck condition. Energy partitioning of elastic waves may vary depending on the extent and continuity of the delamination. Different subjective grades can be assigned to a particular section of a deck as a part of the condition assessment process.
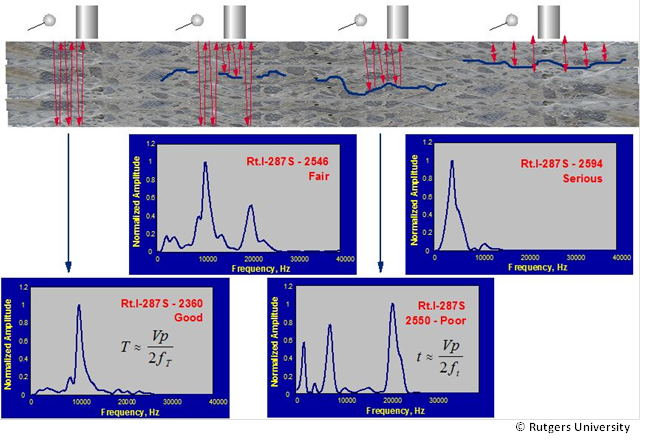
The thickness mode normally dominates the spectral response of a plate-like structure that does not contain any near-surface defects.(3) The frequency of the fundamental thickness mode can be related to the thickness of the deck (figure 4).

- Where:
- β = Correction factor.
- Cp = Compression-wave velocity of concrete.
- fIE = IE frequency.
The spectra shown in figure 5 are examples of IE results for different severity levels of delamination. They correspond to the tested areas above them. In the case of a sound deck (good condition), a distinctive peak in the response spectrum corresponding to the full depth of the deck can be observed. An initial or incipient delamination (fair condition) is identified through the presence of two distinct peaks, indicating energy partitioning from two dominant wave propagation patterns, the first peak corresponding to reflections from the bottom of the deck and the second one to reflections from the delamination. Progressed delamination (poor condition) is characterized by a single peak at a frequency corresponding to a reflector depth that is shallower than the deck thickness, indicating that little or no energy is being propagated towards the bottom of the deck. Finally, in the very severe case of a wide or shallow delamination (serious condition), the dominant response of the deck to an impact is characterized by the low-frequency response of flexural mode oscillations of the upper delaminated portion of the element. This response is almost always in the audible frequency range.
Data Interpretation
IE results are presented in various forms, some describing the position of reflectors, some interpreting the condition with respect to the state of delamination.(1) Some of the approaches are presented below.
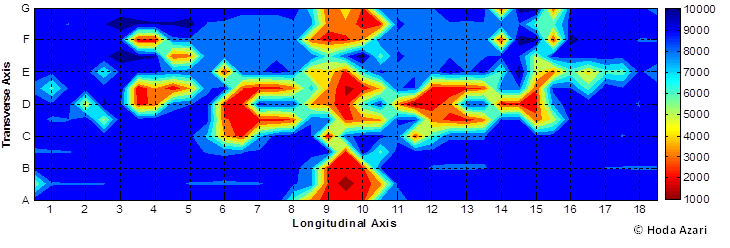
Figure 6 presents the dominant reflectors, or resonators, in terms of the spectral surface. The colors refer to different dominant frequencies identified in the response spectrum. Blue colors, between 8 and 10 kHz, refer to the bottom of the deck, meaning no defect. Red colors correspond to flexural oscillations of shallow delaminations.
The results are often described in terms of different condition grades related to the state of progression of delamination development (figure 7). For example, the fair and poor grades refer to incipient or progressed delamination, and the serious grade corresponds to either shallow or wide delamination.

Advantages
- Can detect delamination at very early stages.
- Can detect debonding of layers, like concrete type overlays.
- Fast data analysis with respect to delamination characterization.
- Unambiguous data interpretation.
- Testing insensitive to traffic induced vibrations.
- Reliable and repeatable when conducted properly by an experienced operator.
Limitations
- Moderate to significant expertise and training required for equipment setup and data collection, processing, and interpretation.
- Slow data collection using traditional single probe equipment; requires lane closure.
- Requires a dense test grid to accurately define the boundaries of delaminated areas, adding to the test duration.
- More complicated to evaluate the condition of overlaid bridge decks; cannot assess the condition of the deck in areas where the overlay is debonded.
- Geometrical and boundary effects should be taken into consideration, especially for structural elements, like girders, piers, and pier caps.
References
- Strategic Highway Research Program, “SHRP2 NDToolbox,” (Website), Washington, DC, Accessed online: February 2015, http://www.ndtoolbox.org/content/bridges.
- ASTM, Standard Test Method for Measuring the P-Wave Speed and the Thickness of Concrete Plates Using the Impact-Echo Method, C1383-04(2010), ASTM International, West Conshohocken, PA, 2010.
- Sansalone, M., and Carino, N., “Detecting Delaminations in Concrete Slabs with and without Overlays Using the Impact-Echo Method,” ACI Materials Journal, Vol. 86, No. 2, pp. 175–184, 1989.
- Gucunski, N., et. al., Nondestructive Testing to Identify Concrete Bridge Deck Deterioration, Report S2-Ro6A-RR-1, SHRP2 Renewal Research, Transportation Research Board, 2013.
- Azari, H., Yuan, D., Nazarian, S., and Gucunski, N., “Sonic Methods to Detect Delamination in Concrete Bridge Decks: Impact of Testing Configuration and Data Analysis Approach,” Transportation Research Record (TRR): Journal of Transportation Research Board, No. 2292, Transportation Research Board of the National Academics, Washington, DC, pp. 113-124, 2012.


