Pavements - Impact Echo (IE)
Target of Investigation
Primary applications of the impact echo (IE) method include the following:
- Estimating the thickness of concrete slabs.
- Detecting and characterizing the delamination of concrete slabs and debonding of overlays.
These applications can also be used on asphalt pavement if the asphalt is cool and stiff.
Description
The IE method uses seismic or stress waves to estimate the thickness of intact concrete members and detect defects, primarily delamination, within concrete members. The objective of an IE survey is to detect and characterize wave reflectors, or resonators, in concrete elements. IE devices can have multiple probes (figure 1) or a single IE probe (figure 2). Each probe consists of an impactor and a sensor.
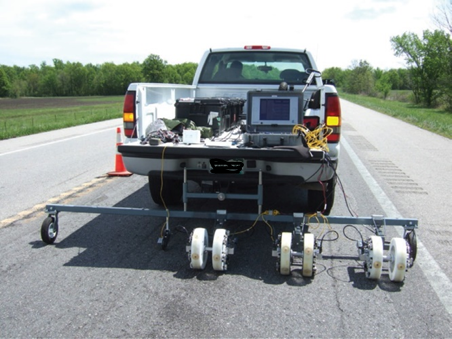 © 2013 TRB.A. Testing with multiprobe IE equipment.
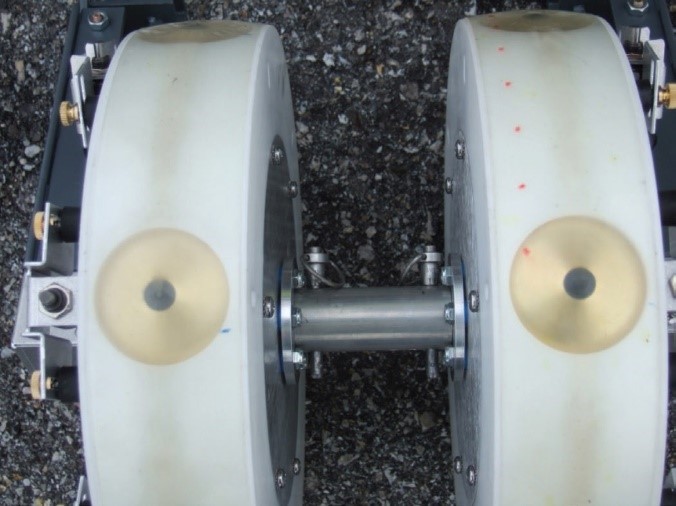 © 2013 TRB.B. Closeup view of probes.
 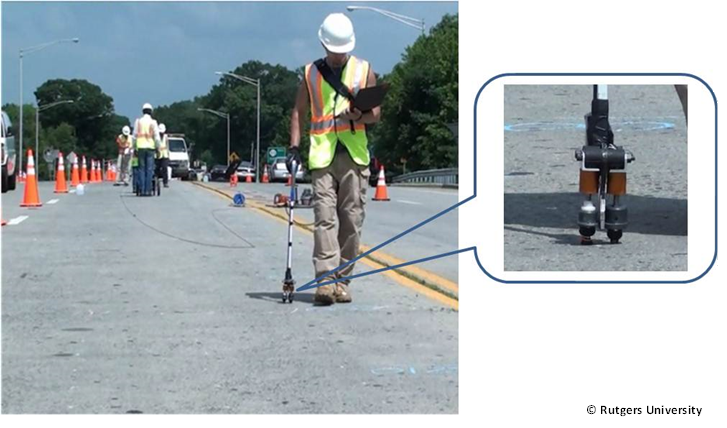 © 2015 N. Gucunski, Rutgers University.
Physical Principle
An IE test is conducted using an impactor and sensor. The impact generates waves that propagate within solid material. Waves are reflected by boundaries or by internal defects, which create a difference in acoustic impedance. The reflected waves, or echoes, return to the surface and are measured by the receiver. In frequency domain analysis, multiple reflected waves monitored by the sensor manifest as resonance conditions. Defects, such as delaminations and big voids, can be detected by differences in the resonant frequency compared to sound areas. The principle of IE is illustrated in figure 3. The resonant frequency of areas with deep delaminations is higher than the sound areas. The resonant frequency of areas with large, shallow delaminations is lower than the sound areas owing to excitation of the flexural mode.
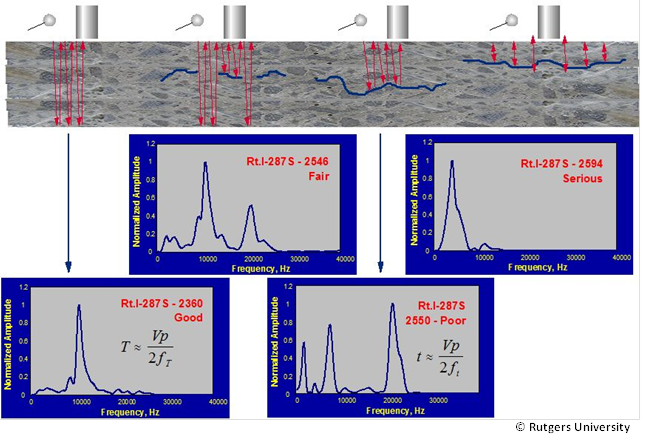 © 2015 N. Gucunski, Rutgers University.T = concrete slab thickness; Vp = Pressure (P-) wave velocity; fT = resonance frequency of the thickness mode; ft = resonance frequency of the delamination.
Data Acquisition
For a complete data collection procedure, refer to ASTM C1383-15, Test Method for Measurement P-Wave Speed and the Thickness of Concrete Plates Using the Impact-Echo Method.(3)
Before IE testing, the testing surface must be cleaned of debris. A grid should be drawn with washable paint or chalk. Data collection can be conducted using a variety of devices that provide different levels of accuracy, speed, and automation.(4)
The IE impactor should be selected carefully to provide enough energy in the frequency range of interest. Some impactors are equipped with a sensor to measure the characteristics of the impact. Many IE systems utilize steel balls of different sizes as impact sources, with the center and maximum frequencies being inversely proportional to the diameter of the ball. However, computer-controlled impactors are also available.
Data Processing
An amplitude spectrum obtained from a fast Fourier transform analysis of the time-domain signal will show dominant peaks at certain frequencies, which can be interpreted to assess the slab thickness or potential delamination or debonding.
The thickness mode normally dominates the spectral response of a platelike structure that does not contain any near-surface defects.(5) The frequency of the thickness mode can be related to the thickness of the member (figure 4).

- Where:
- T = thickness or depth of a defect.
- β = correction factor.
- Vp = Pressure wave velocity of concrete.
- ft = IE frequency acquired from the delamination thickness or the concrete slab thickness.
With the IE method, the accuracy or uncertainty in thickness estimates depends on a pooled error of the return-frequency measurement and the P-wave velocity determination. Research has shown that the typical uncertainty of thickness measurements is 5–10 percent. (See references 2, 3, 6, and 7.) Other factors that may impact uncertainty include the stiffness of the underlying layer, closeness to boundaries, and texture of the concrete surface.(3)
Data Interpretation
IE results are presented in various forms, some describing the position of reflectors, some interpreting the condition with respect to the state of delamination.(8) Figure 5 presents the IE resonant frequencies from an asphalt pavement. The colors refer to different dominant frequencies identified in the response spectrum. Blue and purple indicate low frequencies of flexural resonance, which is caused by shallow delaminations. Light green and yellow indicate resonant frequencies of the normal thickness of the asphalt pavement. Figure 6 presents results in terms of different condition grades related to the progression of delamination development. For example, fair and poor grades refer to incipient or progressed delamination, and a serious grade corresponds to either shallow or wide delamination.
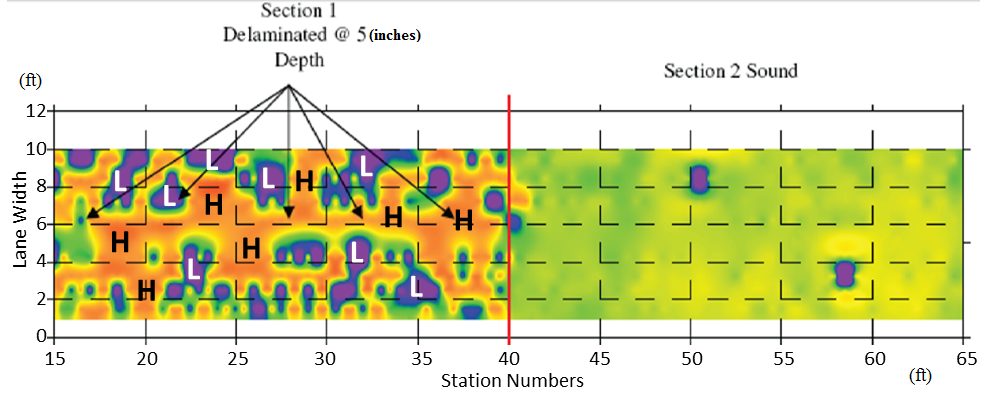 © 2013 TRB.H = high; L= low.1 inch = 25.4 mm; 1 ft = 0.3 m.
 © 2015 Rutgers CAIT.S = serious.1 ft = 0.3 m.
Advantages
Advantages of IE technology include the following:
- Fast data analysis.
- Insensitive to traffic-induced vibrations.
- Reliable and repeatable results.
- Early delamination detection.
Limitations
Limitations of IE technology include the following:
- Requires moderate to significant expertise and training for equipment setup and data collection, processing, and interpretation.
- Necessitates lane closure for slow data collection with traditional single-probe equipment.
- Entails complex evaluation of the condition of an overlaid member.
- Requires consideration of geometrical and boundary effects.
- Cannot estimate thicknesses for members resting on materials of similar stiffnesses.
- Has a limited ability to provide the degree of severity.
- Cannot measure pavement condition below the top of the discontinuity.(8)
References
- Heitzman, M., Maser, K., Tran, N.H., Brown, T., Bell, H., Holland, S., Ceylan, H., Belli, K., and Hiltunen, D. (2013). Nondestructive Testing to Identify Delaminations Between HMA Layers, Report No. S2-R06D-RR-1, Transportation Research Board, Washington, DC.
- Gucunski, N., Imani, A., Romero, F., Nazarian, S., Yuan, D., Wiggenhauser, H., Shokouhi, P., et al. (2013). Nondestructive Testing to Identify Concrete Bridge Deck Deterioration, Report No. S2-R06A-RR-1, Transportation Research Board, Washington, DC.
- ASTM C1383-15. (2015). “Standard Test Method for Measuring the P-Wave Speed and the Thickness of Concrete Plates Using the Impact-Echo Method.” Book of Standards 04.02, ASTM International, West Conshohocken, PA.
- Nazarian, S., Yuan, D., Smith, K., Ansari, F., and Gonzalez, C. (2006). Acceptance Criteria of Airfield Concrete Pavement Using Seismic and Maturity Concepts, Report No. IPRF‑01‑G‑002-02-2, Innovative Pavement Research Foundation, Skokie, IL.
- Sansalone, M. and Carino, N. (1989). “Detecting Delaminations in Concrete Slabs with and without Overlays Using the Impact-Echo Method.” ACI Materials Journal, 86(2),
pp. 175–184, American Concrete Institute, Farmington Hills, MI. - Maser, K.R, Holland, T.J., Roberts, R., Popovics, J., and Heinz, A. (2003), “Technology for Quality Assurance of New Pavement Thickness.” Proceedings from the 82nd Annual Meeting of the Transportation Research Board, Washington, DC.
- Azari, H., Yuan, D., Nazarian, S., and Gucunski, N. (2012). “Sonic Methods to Detect Delamination in Concrete Bridge Decks: Impact of Testing Configuration and Data Analysis Approach.” Transportation Research Record, 2292, pp. 113–124, Transportation Research Board, Washington, DC.
- Strategic Highway Research Program. “SHRP2 NDToolbox.” (website) Washington, DC. Available online: http://www.trb.org/StrategicHighwayResearchProgram2SHRP2/Blank2.aspx, last accessed March 6, 2019.


