Bridge - GPR (Delamination and Corrosion)
Target of Investigation
GPR is a rapid, nondestructive testing method that can be used for a wide range of applications. It can be used to identify and map areas with a high likelihood of corrosion-based deterioration, assess construction quality, determine structural reinforcement layout, and estimate thickness of the deck, overlays, or reinforcement cover.It can also be used for bridge deck and tunnel linings condition assessment, pavement layer thickness measurements, mine detection, archeological investigations, geophysical investigations, borehole inspection, building inspection, etc. Typical GPR applications for bridge elements include the following:(1)
- Measuring concrete cover and mapping rebar configuration.
- Assessing potential for concrete deterioration and delamination.
- Measuring deck thickness and mapping cables, conduits, other embedded objects.
- Identifying heterogeneity in concrete such as rock pockets, honeycombing, and voids.
Description
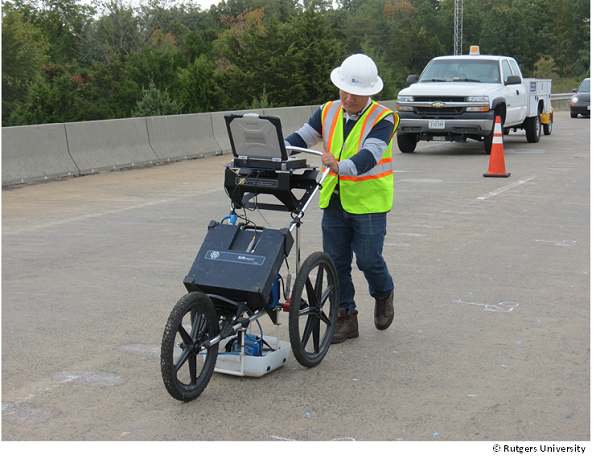
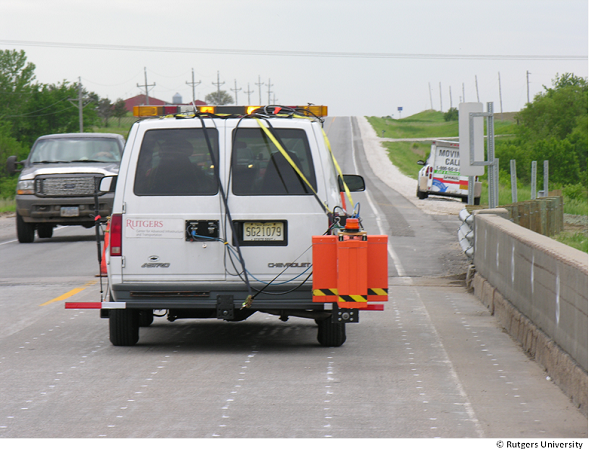
A GPR antenna transmits high-frequency EM waves into the structure and detects the reflected signals. GPR is an accepted technology to diagnose existing structures with apparent deteriorations. GPR is best utilized as a complementary tool in the engineer’s toolbox, rather than as a technology that provides a complete solution to every problem as a stand-alone application. It can be implemented as ground-coupled (figure 1) or air-coupled (figure 2) GPR.
Physical Principle
GPR uses electromagnetic (EM) wave pulses in the microwave band of the radio spectrum to image the subsurface. GPR detects the reflected signals from reflectors (boundaries related to a mismatch of electric properties) in subsurface structures.
A GPR antenna transmits high-frequency EM waves into the structure. A portion of the energy reflected back to the surface from any reflector, such as a rebar or an anomaly, is received by the antenna (figure 3). The remainder of the energy penetrates beneath this interface and is reflected back to the receiver from other interfaces until the transmitted energy diminishes. In the case of an air-coupled antenna, typically suspended 1 to 2 ft above ground, the part of the trace before the first strong reflection represents the travel of EM waves through air.
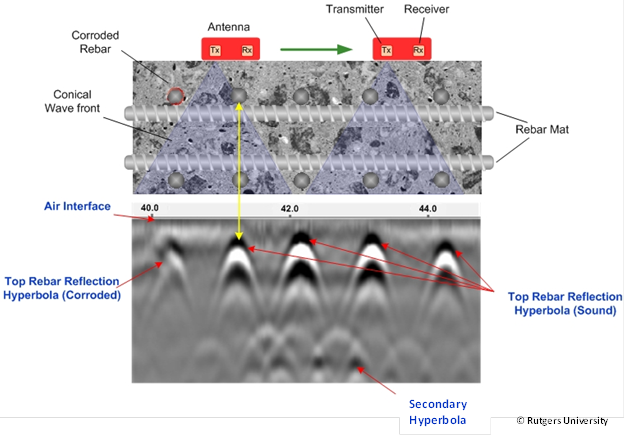
The bridge deck condition is defined by the signals returned to the receiver; the speed at which they return; and other properties of the signal, including amplitude, attenuation, signal polarity, and wavelength. The signal responses are different for various interfaces due to the contrast in the electrical properties of adjacent layers. The electrical properties of primary interest are the electrical conductivity (inverse of resistivity) and relative dielectric permittivity (dielectric constant). These two properties govern the ability of the EM energy to penetrate that particular medium and the speed at which EM waves propagate through the medium, respectively. The contrast in the dielectric constant between adjacent materials dictates the strength of the reflected energy to the surface.
EM waves cannot penetrate into metals (e.g., rebar or metallic expansion joints). Even dense wire screens and thin foils are impermeable to EM waves. The penetration of the GPR’s EM waves is fair to good in most construction materials (concrete, hot mix asphalt, or engineered pavement soils). GPR signal’s penetration in concrete that is moist and high in free chloride ions (e.g., fresh concrete) or other conductive materials can be adversely affected. For example, the GPR signal will be highly attenuated in a reinforced concrete deck that has undergone severe corrosion induced deterioration, and limit the depth of assessment. Dielectric constant for typical construction materials, including concrete, are shown in the following table 1.
Table 1. Relative Dielectric Permittivity for Different Materials.
| Material | Dielectric Constant* |
| Air | 1 |
| Clay | 25-40 |
| Concrete | 8-10 |
| Crushed base | 6-8 |
| Gravel | 4-7 |
| Hot mix asphalt | 4-8 |
| Ice | 4 |
| Insulation board | 2-2.5 |
| Sand | 4-6 |
| Silt | 16-30 |
| Silty sand | 7-10 |
| Water (fresh) | 81 |
Data Acquisition
Data collection with GPR should be carried out by an experienced and qualified operator. The following list comprises the general steps required to achieve quality results on bridge decks:
- Turn on the GPR system, and allow it to stabilize (warm up) while adjusting settings and calibrating survey wheel/distance measuring instrument.
- Calibrate survey wheel/distance measurement instrument (DMI) on a fixed distance over the deck’s surface, roughly one-third to one-half of the deck length.
- Set up signal position for top of scan, gain, vertical high-pass (HP), and low-pass (LP) filters based on recommendations from the manufacturer.
- Set up GPR sampling window for sufficient time range (8 to 12 ns for a ground-coupled, and up to 40 ns for an air-coupled antenna), vertical sampling (512 samples/scan, but ranging from 256 to 1024), scan rate (100 to 400 scans/second), and spatial scan density (24 to 60 scans/ft for a ground-coupled, and about 12 scans/ft for an air-coupled antenna).
- Collect data and perform quality control review of onscreen output that is sent to permanent storage (hard drive, flash drive, memory stick, or other medium).
Simple data collection on a bridge deck can be accomplished on a series of lines spaced about 2 ft apart, using a hand-pushed or pulled cart with an encoder-based wheel or a vehicle mounted air-coupled antenna. Smaller carts allow access into tighter confines (e.g., where deck meets curb, parapet, jersey barriers, etc.). The GPR survey lines should be perpendicular to the direction of top reinforcement. If the survey is conducted in the direction parallel to the orientation of the top reinforcement, the survey should be conducted with two antennas of dual polarization. For concrete girders (precast prestressed, post-tensioned, cast-in-place concrete girders), GPR field data are typically collected at a spacing equal to or less than the rebar spacing within the girder. A 1-ft by 1-ft (or more closely spaced) grid is usually used to map voids and delamination, and to image, locate, and map reinforcement within the girder and the layout of any embedded conduits, post-tensioned cables, or prestressing strands. Position and depth can be determined reasonably accurately if the measurements are performed properly.
Data Processing
The attenuation of the GPR signal at the top rebar level is normally used to represent the condition of the deck.(1) When the antenna is centered directly above the rebar, the highest amplitude return for the area near the rebar is obtained. This amplitude will be highest when the deck is in good condition and lowest when delamination and corrosion is present. Amplitudes for all points are normalized with respect to the best possible condition to obtain the plot of attenuation.
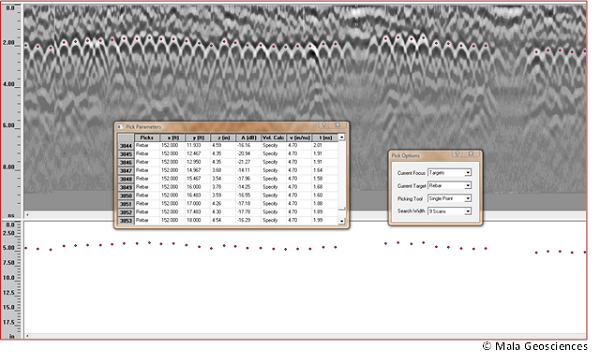
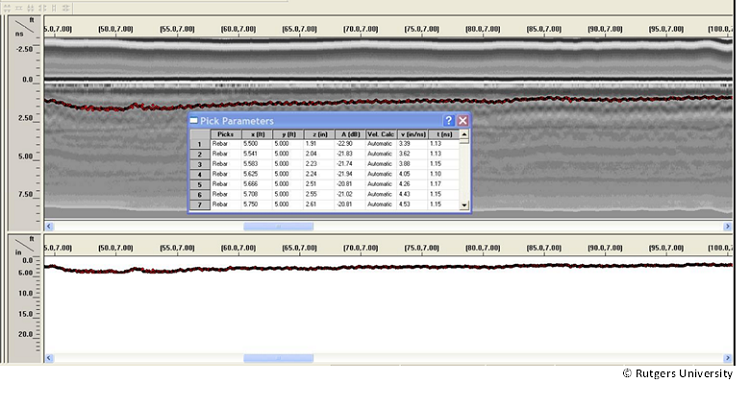
The first step in the processing sequence is the automatic rebar reflection picking, often accompanied by verifying the picks using interactive interpretation. The result of the process is a table of rebar position (depth) and amplitude of reflection (figure 4). Since the rebar depth can significantly influence signal attenuation, measured reflection amplitudes are corrected for rebar depth variations. Once the attenuation map is completed, a unique deterioration threshold is established using ground truth, such as cores or other NDE methods to provide the results interpretation. For example, impact echo or chain drag data can be used to establish thresholds of delamination, or electrical resistivity data to establish thresholds of corrosive environment.
Because the air-coupled antenna is suspended above the ground surface, the energy transmitted from the antenna is more dispersed as it reaches the surface of the tested object. As a result, the rebars clearly visible as individual hyperbolas in the ground-coupled antenna data, appear as a layer in the air-coupled antenna data. This is illustrated in figure 5 as a “rebar layer” instead of individual rebars.
Data Interpretation
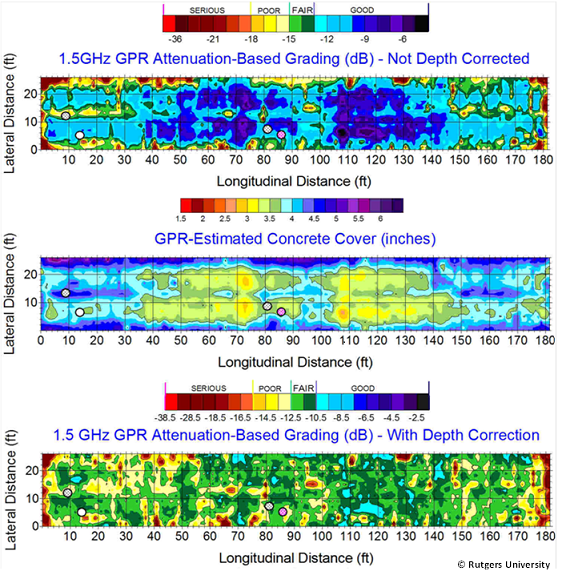
Data interpretation is performed on a contour map by using certain attenuation thresholds (figure 6). When the concrete cover thickness varies significantly, the depth-corrected attenuation map provides more accurate description about the deck condition, in comparison to the simple amplitude mapping technique.
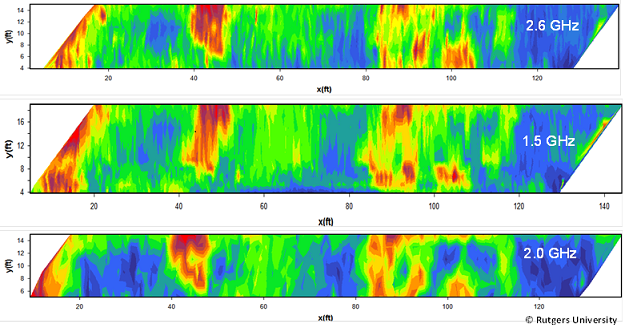
As illustrated in figure 7, ground- and air-coupled antennas can provide similar pictures of the condition of a bridge deck. The attenuation maps were generated for the data collected by three antennas: 1.5 GHz and 2.6 GHz ground-coupled antennas, and a 2.0 GHz air-coupled antenna. All three antennas identify, in general, same areas of likely deterioration. (Note a slight difference in the size of surveyed sections by the three antennas.) The primary difference is in the horizontal resolution of the identified areas.
Advantages
- Well-established field data collection processes.
- Much more rapid than other methods.
- Reliable and repeatable.
- Correlates well with electrical resistivity to describe corrosive environment.
- Correlates well with other NDE methods when the defects are severe.
Limitations
- Requires advanced expertise and training for data collection, processing, and interpretation.
- Primarily sensitive to identifying corrosive environment within the upper half of the deck when measurements are made from the deck surface.
- Data negatively influenced by extremely cold conditions.
- De-icing agents can limit the signal penetration.
- Does not directly assess deck delamination, except under very restrictive conditions (e.g., epoxy-injected repairs that are separating two deck sections or delaminated areas filled with water).
- Requires calibration with other NDE methods and other ground truth activities.
- Less cost-effective than other methods, particularly when applied to smaller individual structures.
- Accuracy is limited to position and depth of bars in the upper half of the deck. Lower half of the deck can be difficult because of the rebar mat in the upper half.
References
- ASTM, Standard Test Method for Evaluating Asphalt-Covered Concrete Bridge Decks Using Ground Penetrating Radar, D6087-08, ASTM International, West Conshohocken, PA, 2008.


