Underground Utilities - Ground-Penetrating Radar (GPR) — Concrete
Target of Investigation
Ground-penetrating radar (GPR) is a geophysical nondestructive evaluation (NDE) technique that uses electromagnetic (EM) signals to detect and identify subsurface anomalies based on changes in electrical conductivity and relative dielectric properties of the subsurface layers. Since the 1970s, GPR has found applications in civil engineering, environmental monitoring, geological surveying, forensic science, landmine detection, archaeological investigations, and oil and gas exploration.(1) While GPR has a variety of uses in civil engineering that range from concrete condition assessment to steel reinforcement mapping, one major area of application lies in the detection, location, and mapping of subsurface utility lines. With the development of high-speed computers and advanced user interfaces, GPR can provide real-time feedback and results to an operator seeking to locate buried utilities and utility pipes and mark them onsite. At the same time, GPR enabled with Global Positioning System (GPS) technology can facilitate the creation of precise maps for project planning and management.
Description
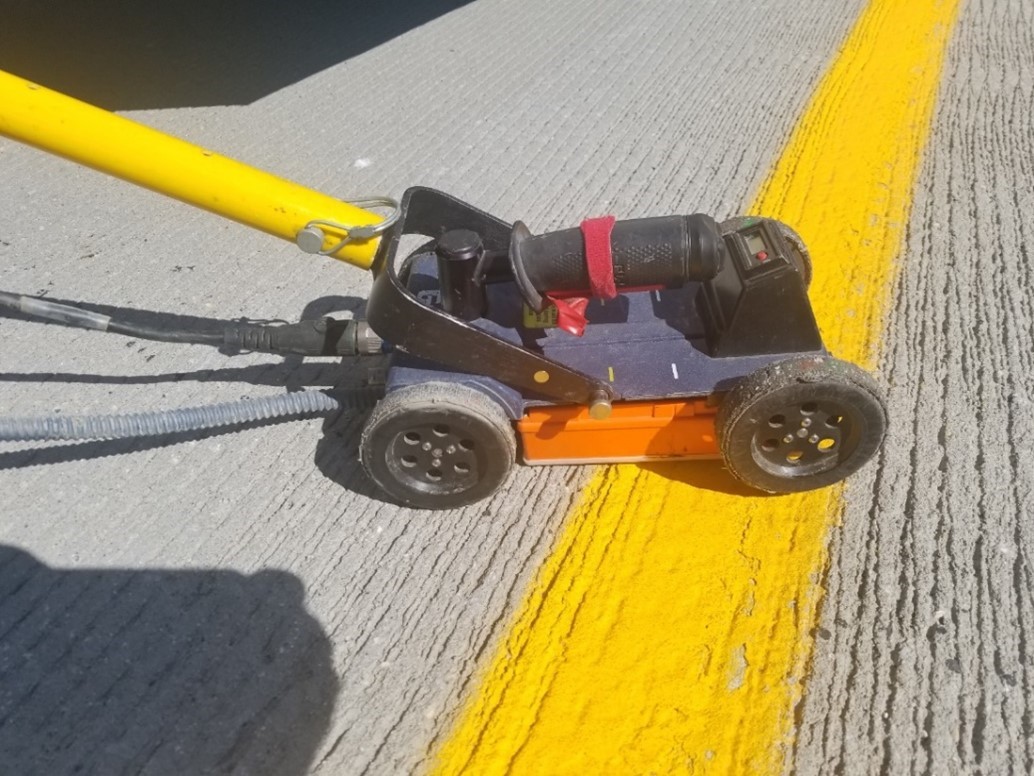
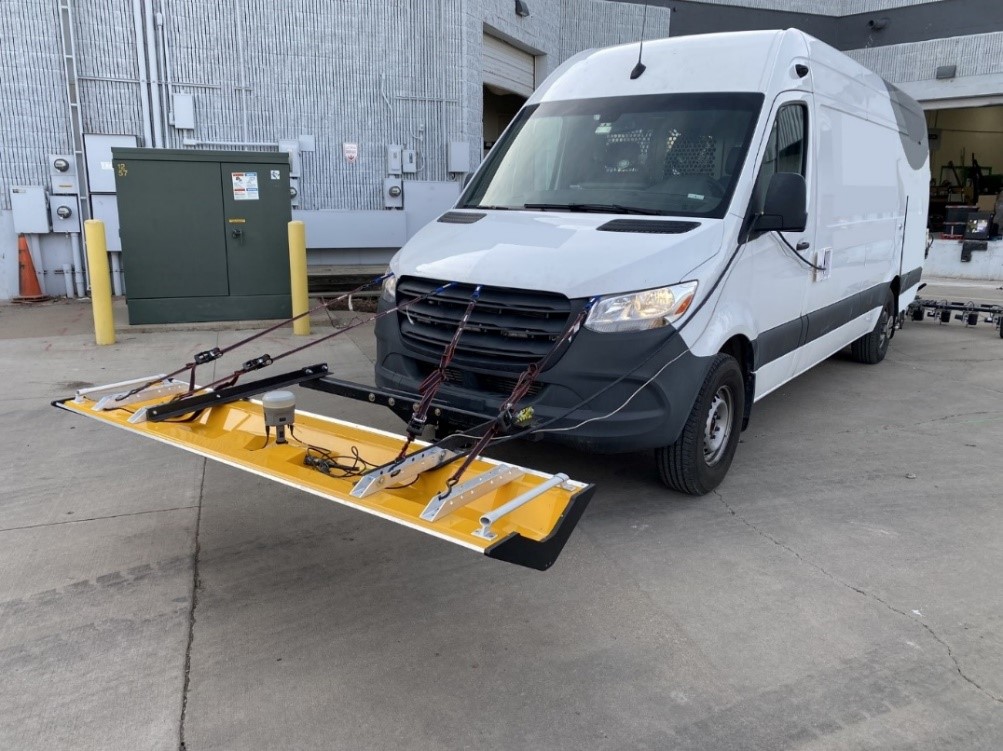
The GPR antenna configuration has undergone considerable development since its inception, with options for its deployment mode, frequency configuration, and channel configuration. GPR uses an appropriate antenna configuration to send EM waves into a given material and receive the response from the material and its contents for processing and presentation by a data acquisition system. Users can deploy GPR systems with either a ground-coupled antenna (figure 1) to maximize signal transmission into a given test site or an air-coupled antenna (figure 2) to gather data at higher speeds with minimal effects from test surface conditions.
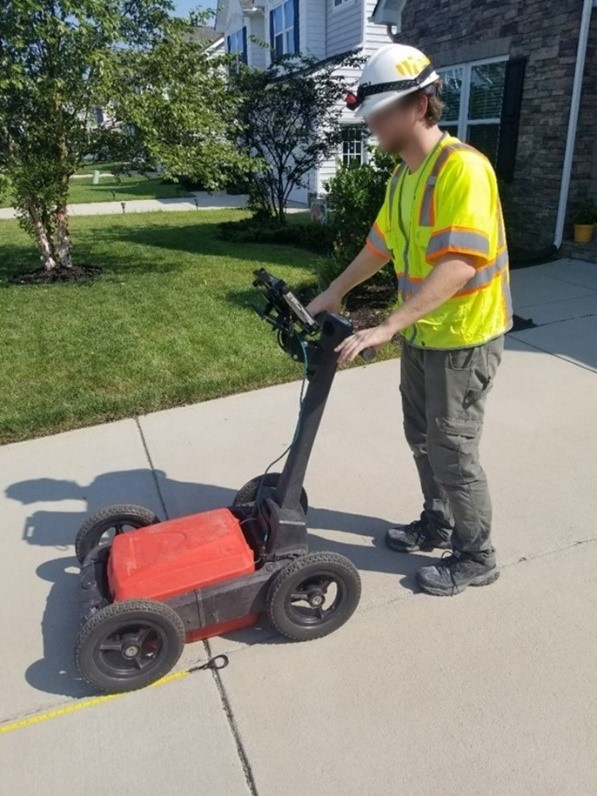
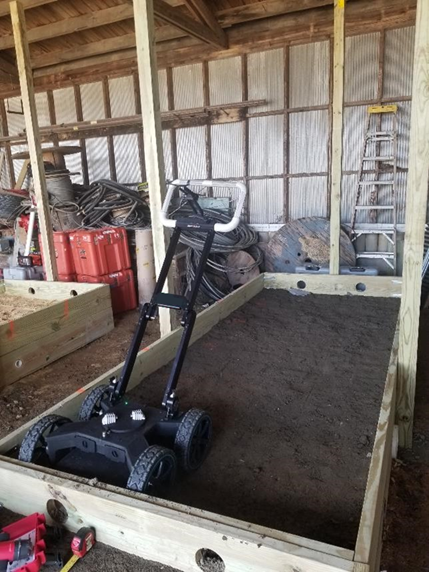
Antenna frequency mediates the penetration depth and imaging precision using GPR, with relatively high frequencies offering low penetration depth and high precision, while relatively low frequencies offer high penetration depth and low precision. Historically, GPR antennas were only capable of transmitting and receiving signals at a single center frequency, meaning the operator would have to compromise between imaging depth and precision. GPR antennas still provide an economical option for investigations where a utility line is located within a known depth range. However, modern developments in antenna technology have expanded the availability of cost-effective multifrequency antennas (figure 3) that allow operators to scan at multiple frequencies when the appropriate depth and precision balance cannot be determined ahead of testing. In contrast, stepped-frequency antennas (figure 4) can sweep through a broad spectrum of frequencies to eliminate the need for compromise at a higher initial cost.
Antennas can also be configured into multichannel arrangements where data is gathered in parallel to minimize test time and downtime for a given investigation area. Gathering multiple sets of data at the same time can mean greater hardware costs as more antennas or antenna arrays are needed to perform the work. However, this higher initial cost is offset by reducing operator hours in the field while providing a dense scan coverage of the area.
Finally, GPR systems can be deployed using an operator-driven approach for navigating difficult terrain or using a vehicle-based approach for scanning roadways at relatively high speed.(2) Where a given buried utility and its material type can be (electromagnetically) distinguished from the surrounding geology, GPR represents an accepted technology for locating and mapping subsurface utility lines. As with most NDE methods, GPR is best used as a complementary tool in the engineer’s toolbox rather than as a stand-alone technology that provides a complete solution to every problem.
Physical Principle
A GPR system consists of an antenna that transmits EM waves in the microwave band of the radio spectrum into a given material, an antenna that receives the EM response of the contents of that material, and a data acquisition system for processing and presenting the response. A single response gathered by the GPR typically results in the presentation of an arrival time and amplitude that is related to the location and nature of changes in material property of any subsurface features or layers directly below the antenna, specifically the dielectric permittivity of those materials. In the extreme, a vacuum theoretically has a dielectric permittivity of 0 and would allow a complete transfer of EM waves. A perfect conductor, such as steel and other metallic elements, would have an infinite dielectric permittivity and cause an ideal reflection of the waves. These differences in dielectric permittivity values create dielectric discontinuities that reflect energy and allow buried utility lines to be detected where a significant difference in material properties is present. The GPR system captures the reflected energy and displays the response through the data acquisition system to form a series of scans referred to as the radar signal. By combining a series of sampled signals into a single image called a B-scan (figure 5), the GPR system can identify features within the subsurface material.
With many recent advancements, GPR can be deployed in a variety of configurations to address different conditions and investigation needs, each with its own economic, logistical, and technical strengths and weaknesses. Antennas can be designed for use in ground-coupled applications where the antenna system is pulled directly over the material under investigation or in air-coupled applications where the antenna system is suspended 1 to 2 ft (0.3 to 0.6 m) above the ground.
For systems that use single-frequency antennas, operators should select the appropriate antenna for a given application, considering the necessary frequency and potential access issues that an antenna may present. When selecting an appropriate antenna frequency, operators should strike a balance between the inspection depth and measurement precision. Relatively low-frequency antennas tend to provide deep penetration depth at the cost of measurement precision, while high-frequency antennas tend to provide shallow penetration depth to deliver high-precision measurements. In buried utility applications, operators tend to select low-frequency antennas in the range of 100 MHz (penetration depth up to 100 ft (30 m)) to 400 MHz (penetration depth up to 12 ft (3.7 m)). Operators should also consider the physical footprint of the antenna. Antennas must be larger for lower frequencies, which can present challenges in locations where space is limited or terrain is uneven. Regardless of frequency or antenna size, the overall operating principles of GPR remain the same for the final presentation and interpretation of the gathered scan data, even if the data collection and processing are altered to meet the needs of a given investigation (figure 5).
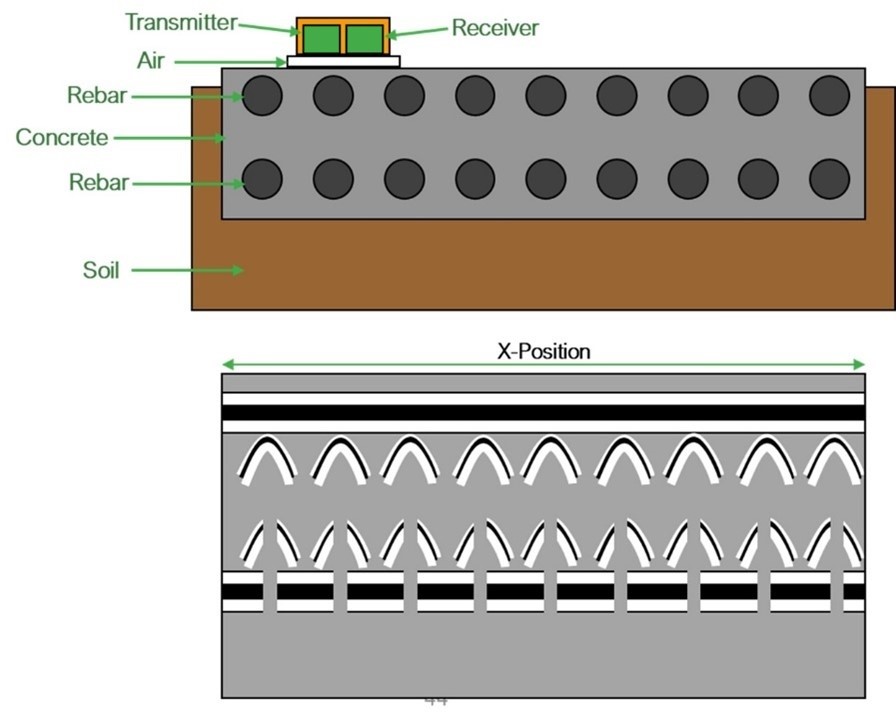
Within the B-scan presentation of the GPR data, a buried utility pipe tends to appear as a distinct hyperbolic feature against the background reflection noise of the surrounding material. The signals returned to the receiver; the speed at which they return; and other properties of the signal, including amplitude, attenuation, signal polarity, and wavelength, define the buried utility. The signal responses are different for various interfaces due to the contrast in the electrical properties of adjacent layers. The electrical properties of primary interest are the electrical conductivity (inverse of resistivity) and relative dielectric permittivity (dielectric constant). These two properties govern the ability of EM energy to penetrate a particular medium and the speed at which EM waves propagate through that medium, respectively. The contrast in the dielectric constant between adjacent materials dictates the strength of the reflected energy to the surface, where a larger difference in the value of the dielectric constant corresponds to better feature identification.
EM waves cannot penetrate metals (e.g., steel pipes and metal sheets), which means that GPR cannot image any features below a metal object or layer. Soils containing significant amounts of moisture or clay tend to attenuate the EM waves as well, leading to significant limitations in utility location in such environments.(4) However, in otherwise dry and nonclay conditions, GPR is an effective tool for locating buried utilities made of sufficiently distinct dielectric properties from the surrounding material.
Table 1 presents dielectric constants for typical material types encountered in utility investigations.(5) In the specific case of concrete pipes, the dielectric constant is within the range of dielectric constants for typical soils, which means that the signal response from the pipe may be relatively weak or indistinguishable from the surrounding material. The geometry of the pipe can sometimes generate the distinctive signal that allows the GPR to detect the pipe relative to the background response of the soil, but locating concrete in soil remains a significant challenge for GPR, with efficacy being tested on a case-by-case basis.
Table 1. Relative dielectric permittivity for different materials.(5)
| Material Type | Dielectric Constant |
| Air | 1 |
| PVC | 3 |
| Concrete | 4–11* |
| Granite | 4–7* |
| Sandstone | 6* |
| Shale | 5–15* |
| Limestone | 4–8* |
| Basalt | 8–9* |
| Soils and sediments | 4–30* |
| Water | 81 |
| Steel | Infinite** |
**All metals represent perfect conductors that reflect all incoming EM waves.
Data Acquisition
Data collection with GPR should be carried out by an experienced and qualified operator. The following list comprises the general steps required to achieve quality results during a utility investigation.
Fieldwork Preparation
- Identify an area of interest for the investigation with an appropriate coordinate system laid out using semipermanent marking paint to identify the area’s extents and major features. This coordinate system should have the following features:
- A well-defined, easily identifiable, and reasonably permanent origin from which all lateral measurements across the test area can be referenced.
- An intuitive selection of the x- and y-axis orientation for the coordinate system.
- Indications at regular intervals along each grid axis to denote the distance from the reference origin to identify the start location and orientation of a given scan.
- Document the coordinate system with a sketch from the field showing the appropriate measurements of the coordinate system’s extents, reference origin, x- and y-axis orientation, and a north arrow. In addition, document the weather conditions, soil conditions, and other relevant details for context (metadata) when analyzing the gathered data.
- Complete the definition of the test area extents, even when using GPR in combination with GPS, for quality control of the data positioning. In this case, the extents are locked in using appropriate GPS equipment and relevant procedures for coordinate lock-in operations.
- Determine and document the intervals along the test area where the scans will be gathered, forming a test grid. Scans should be taken in both the x- and y-direction along the grid because GPR antennas are generally polarized, so they can only detect pipes oriented perpendicular to the direction of scanning. A typical spacing may be 5 ft (1.5 m) in either direction, with a 2-ft (0.6-m) spacing for high-resolution imaging.
- Develop and follow a notes package that records the start position, orientation, and relevant GPR filename for each scan gathered to use in analyzing and reporting the data.
System Operation
- Connect all appropriate system elements such as the antenna, data acquisition system, distance measurement instrument (DMI), and GPS system.
- Power on the GPR system per the manufacturer’s instructions and review all system components to ensure the GPR system can send and receive data with the data acquisition system.
- Calibrate the survey wheel/DMI at a fixed distance of approximately half the length of the test area.
- Follow the manufacturer’s instructions for inputting the appropriate data collection parameters into the data acquisition system to ensure GPR data is gathered with sufficient resolution, depth of scan, gain, and other features. Typical parameters to consider include the following:
- Antenna frequency—This parameter should match the connected antennas and may be adjusted depending on the capabilities of the specific antenna.
- Samples—This parameter typically refers to the number of samples composing a single given GPR scan trace, where the higher the sample number, the higher the resolution and file size. Values tend to range from 256 to 1,024, with 512 being generally sufficient.
- Range—This parameter typically refers to the time window for which the data acquisition system will be open for receiving incoming reflections from the material under investigation. Some systems may allow for selecting an explicit maximum depth that correlates to the time window by way of an assumed dielectric constant. However, where assumed dielectric constants are not valid, the time window will be measured in nanoseconds (ns) with values in the range of 20 to 75 ns, which correspond roughly to a range of 4 to 15 ft (1.2 to 4.6 m) for an assumed dielectric constant of 6.
- Dielectric constant—This parameter should be estimated from the local soil conditions, where ideally, a soil sample has been gathered and analyzed ahead of testing.
- Gain—This parameter represents a form of postprocessing that increases or decreases the contrast of the data for field review or analysis purposes.
- Scan rate—This parameter controls the rate at which each individual scan composing the B-scan is collected, where a higher scan rate corresponds to better data resolution but a slower data collection process.
- Filtering options—This parameter applies various signal processing filters to the data, depending on the system, to optimize the signal for the antenna in use.
Field Data Collection
- Collect the data according to the manufacturer’s instructions on system operation, beginning with the antenna aligned on the appropriate start location on the coordinate system. Complete the scan collection systematically along the test grid in both directions, with notes and documentation gathered where appropriate.
- Review the data in realtime while scanning the area to ensure data are actually being gathered and meet a minimum quality standard.
- Mark, if desired, features onsite with marking paint as they are discovered during scanning.
- Perform a quality-control review of the onscreen output that is sent to permanent storage (hard drive, flash drive, memory stick, or another medium) after completing the scanning.
Data Processing
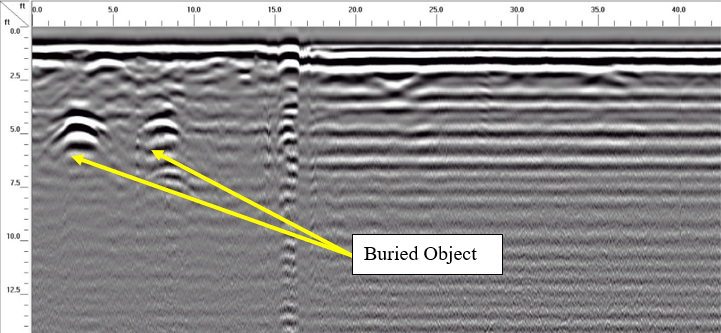
Modern GPR software packages have automated tools for identifying hyperbolic features when investigating structures with relatively clean and consistent subsurface features, such as steel reinforcement in bridge decks. However, these automated tools tend to struggle when used to detect singular features like an individual utility line, meaning that hyperbolic features representing such utilities must be manually selected and evaluated for veracity. When hyperbolic features are selected in the software, the depth, dielectric constant assumed, scan position, GPS coordinates, and other relevant measurements are documented in a tabular format for analysis and reporting. For concrete utilities, significant postprocessing may be needed to resolve the desired features, using a combination of noise removal algorithms and gain controls to improve visibility in the data.(6) Figure 6 provides an example of a given B-scan presenting buried utility features as hyperbolas.
Data Interpretation
By analyzing each B-scan gathered during field data collection, operators can map the selected features in conjunction with either the GPS data or x–y coordinates documented in the notes. This mapping process will present clear alignment patterns between each disparate feature location, indicating the presence of the utility. Distinguishing between the features is important because a single feature in a single scan does not necessarily correspond to a buried utility. The aggregation of multiple scans crossing over the utility line is needed to demonstrate confidence in both its lateral location and its orientation and depth. Calibrating the results using physical verification or soil samples directly from the test area to fine-tune the selected dielectric constant is desirable.
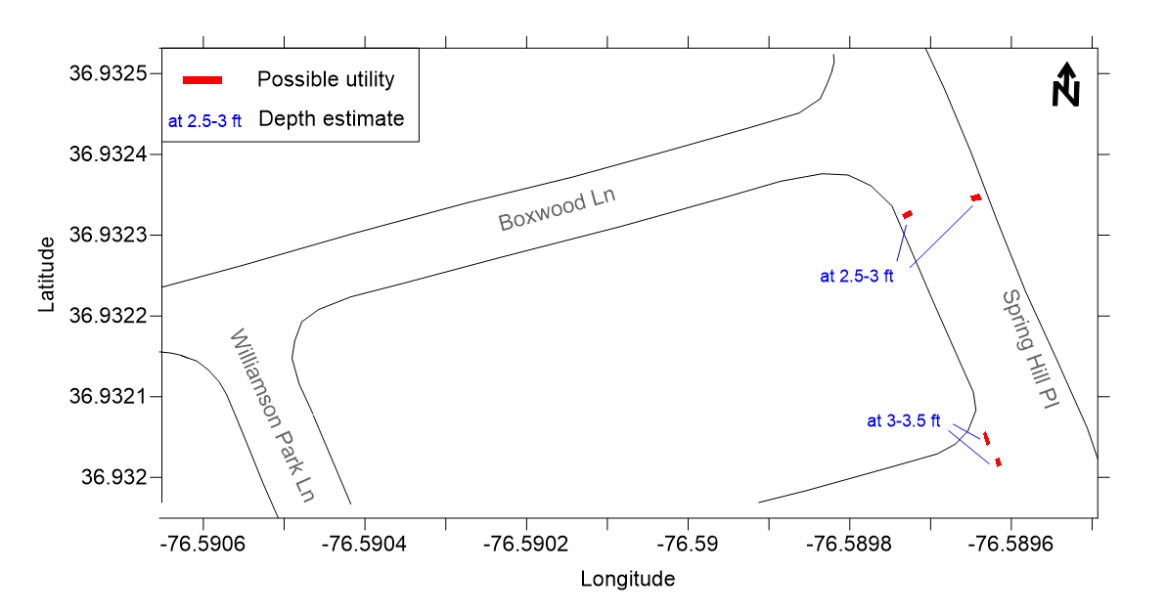
When using imaging software, two-dimensional plan view maps or three-dimensional transparency maps can better illustrate how the utilities are oriented in reference to the overall test area (figure 7).
Advantages
- Well-established field data collection processes.
- Much more rapid data collection speeds than other methods.
- Reliable and repeatable method, especially for utilities made of metal.
- Real-time marking of utility features.
Limitations
- Advanced expertise and training are required for data collection, processing, and interpretation.
- Data quality is controlled by the environment. Data are negatively influenced by significant moisture content or clay in the area under investigation.
- Single-frequency antennas require compromises between penetration depth and measurement precision; deploying multiple antennas can be costly in terms of asset acquisition and time spent collecting data.
- High-resolution imaging of a test location’s subsurface with single-channel antennas requires many scan lines, which can take considerable time in the field.
- Concrete utilities can be challenging to locate because of insufficient differences in dielectric constant from the surrounding material.
- Equipment calibration with other NDE methods and other ground-truth activities is required.
References
- Lai, W. W.-L., X. Dérobert, and P. Annan. 2018. “A Review of Ground Penetrating Radar Application in Civil Engineering: A 30-Year Journey from Locating and Testing to Imaging and Diagnosis.” NDT&E International, 96, 58–78.
- Young, G. N., and C. M. Kennedy. 2015. Utility-Locating Technology Development Using Multisensor Platforms. Report No. S2-R01B-RW-1. Washington, DC: The National Academies Press.
- Reiter, D., V. Napoli, J. Cohen, S. Boone, P. Moseley, A. Alhasan, and J. Salerno. 2023. Availability, Feasibility, and Reliability of Available Nondestructive Evaluation (NDE) Technologies for Detecting and Locating Buried Utilities. Report No. FHWA-HRT-23-037. Washington, DC: Federal Highway Administration.
- American Society of Civil Engineers. 2002. Standard Guidelines for the Collection and Depiction of Existing Subsurface Utility Data. New York, NY: American Society of Civil Engineers.
- Reynolds, J. M. 1997. An Introduction to Applied and Environmental Geophysics. Chichester, West Sussex, UK: John Wiley & Sons.
- ASTM International. 2008. Standard Test Method for Evaluating Asphalt-Covered Concrete Bridge Decks Using Ground Penetrating Radar. D6087-08. West Conshohocken, PA: ASTM International.


