Underground Utilities - Frequency-Domain Electromagnetic (FDEM) Method — Metal/Steel
Target of Investigation
The frequency-domain electromagnetic (FDEM) method is a geophysical nondestructive evaluation (NDE) technique that uses electromagnetic (EM) signals to detect and identify subsurface anomalies based on changes in electrical conductivity within an area of investigation. While the FDEM method tends to be used in surveys to determine the electrical properties of a given area’s geology, the ability to induce electrical currents in metallic subsurface targets makes FDEM an option for detecting buried pipes and utilities. The systems FDEM uses tend to be rather sensitive to surface conditions, but with expert handling and data interpretation, these systems can provide utility detection results at reasonable acquisition speeds and with portable hardware.
Description
FDEM uses an enclosure containing two separate electrical coils at either end. One coil acts as a transmitter to send time-varying EM waves into a given material, while the other coil receives the material’s response and contents for processing by a data acquisition system. The data acquisition system then presents the user with a visual display of the average conductivity taken as a function of time. Data acquisition systems often lack a physical encoder, using instead an attached Global Positioning System (GPS) device to connect measurements with their respective positions in a test area.
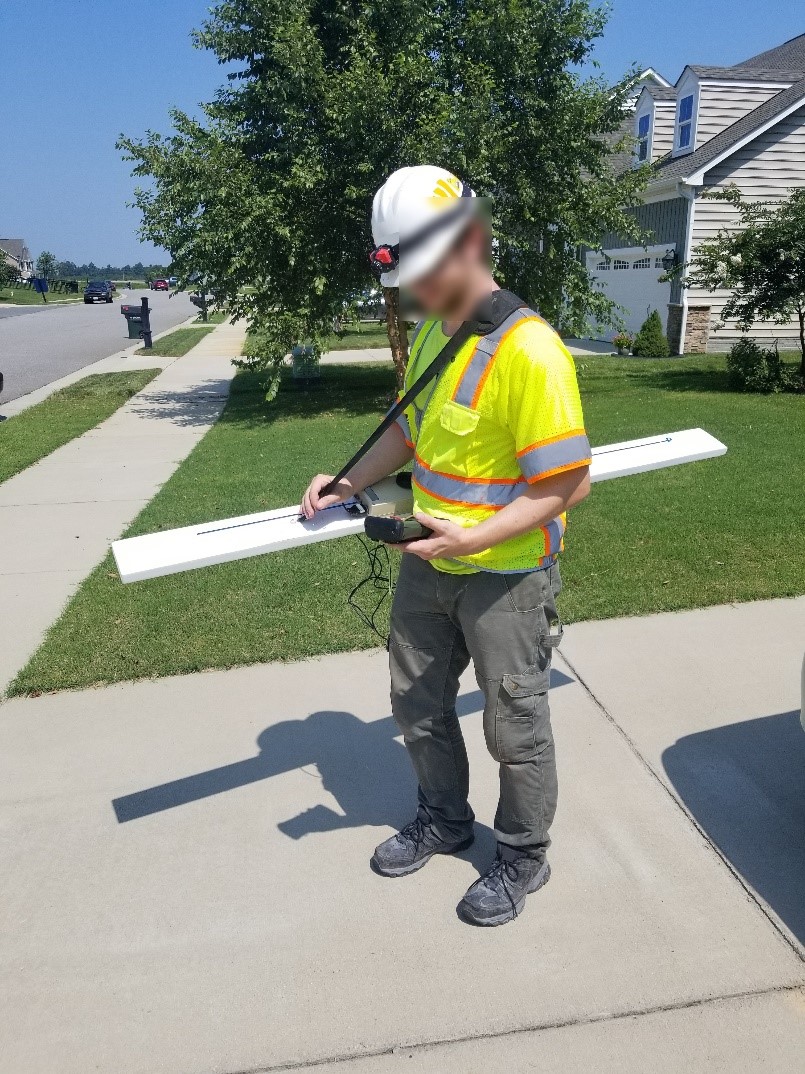
The transmitter, receiver, and data acquisition equipment tend to be operator-portable, with the technician holding the instrument a few feet off the ground (figure 1). Operators can use local anomalies observed in the conductivity measurements to identify the presence of a buried utility. FDEM represents an accepted technology for locating and mapping subsurface utility lines when one of these anomalies can distinguish a buried utility and the utility’s material type from the surrounding geology. As with most NDE methods, FDEM is best used as a complementary tool in the engineer’s toolbox rather than as a stand-alone technology that provides a complete solution to every problem.
Traditional FDEM deployments use a pair of electrical coils within a single, operator-portable enclosure, and operators gather scans on foot. However, the recent development of the complementary time-domain electromagnetic (TDEM) method provides a multichannel, vehicle-based system for use on roadways that could theoretically be used for FDEM.(1) The TDEM method collects data at higher speeds and efficiency than traditional approaches, gathering data from a moving vehicle with multiple sensor arrays working in parallel to minimize the number of collection passes. The major drawback is the initial cost of the more sophisticated hardware unit and data acquisition software underlying it relative to simpler, traditional systems.

Physical Principle
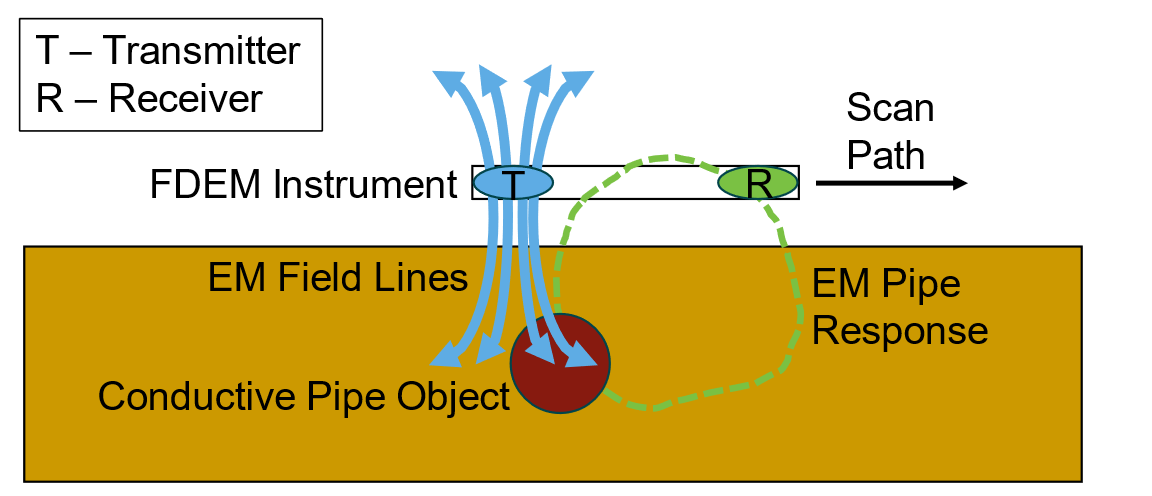
FDEM is based on the principles of induced secondary currents, known as eddy currents. A transmitter coil connected to an alternating current source emits a primary magnetic field that produces an eddy current in the earth directly below the coil (figure 2). The eddy currents flow to the surface with slightly different properties when they encounter a buried object with conductivity different from the surrounding soil. A receiver at the ground level uses the differences between the emitted and induced currents to detect underground utilities. For instance, a buried metallic object has a lower conductivity than the soil surrounding it. Therefore, the eddy currents have a different value than the currents emitted. The alternating current sweeps through a variety of frequencies to accommodate the induction of different types of possible subsurface utilities that may respond better or worse to a particular frequency depending on material type and depth.

The data acquisition system defines the buried utility by the average conductivity measurements based on the signals gathered at the receiver, namely where a local deviation from the surrounding average conductivity is observed.
EM waves cannot penetrate metals (e.g., steel pipes and metal sheets), which means that FDEM cannot image any features below a metal object or layer. Soils containing significant amounts of moisture or clay and local metallic surface objects, such as fences or sewer tops, tend to attenuate the EM waves as well, leading to significant limitations in utility location in such environments.(3) In addition, FDEM cannot detect fiber optic and polyvinyl chloride (PVC) pipes on their own. Recent investigations of TDEM for utility location were unsuccessful in locating nonferrous electrical lines, suggesting that FDEM would have similar limitations.(1) Some utility providers will overcome this limitation by attaching a metallic tracer cable alongside the nonmetallic utility line to provide an accessible detection method for the FDEM instrument. However, in otherwise dry and nonclay conditions, FDEM can be an effective tool for locating buried utilities made of sufficiently distinct dielectric properties from the surrounding material.
Data Acquisition
Data collection with FDEM should be carried out by an experienced and qualified operator. The following list comprises the general steps required to achieve quality results during a utility investigation.
Fieldwork Preparation
- Identify an area of interest for the investigation with an appropriate coordinate system laid out using semipermanent marking paint to identify the area’s extents and major features. This coordinate system should have the following features:
- A well-defined, easily identifiable, and reasonably permanent origin from which all lateral measurements across the test area can be referenced.
- An intuitive selection of the x- and y-axis orientation for the coordinate system.
- Indications at regular intervals along each grid axis to denote the distance from the reference origin and identify the start location and orientation of a given scan.
- Document the coordinate system with a sketch from the field showing the appropriate measurements of the coordinate system’s extents, reference origin, x- and y-axis orientation, and a north arrow. In addition, document the weather conditions, observed soil conditions, and other relevant details for context when analyzing the gathered data.
- Complete the definition of the test area extents, even when using FDEM in combination with GPS, for quality control of the data positioning. In this case, the extents are locked in using appropriate GPS equipment and relevant procedures for coordinate lock-in operations.
- Determine and document the intervals along the test area where the scans will be gathered, forming a test grid. Scans should be taken in both the x-direction and y-direction along the grid because FDEM systems are generally polarized, so they can only detect pipes oriented perpendicular to the direction of scanning. A typical spacing may be 5 ft (1.5 m) in either direction, with a 2-ft (0.6-m) spacing for high-resolution imaging.
- Develop and follow a notes package that records the start position, orientation, and relevant FDEM filename for each scan gathered to use in analyzing and reporting the data.
System Operation
- Connect all appropriate system elements, such as the FDEM instrument, data acquisition system, and GPS system.
- Power on the FDEM system per the manufacturer’s instructions and review all system components to ensure it can send and receive data with the data acquisition system.
- Ensure the GPS system has a sufficient number of satellite location locks to take precise position measurements.
- Follow the manufacturer’s instructions for inputting the appropriate data collection parameters into the data acquisition system to ensure that the most relevant frequency range is swept and the signals are sufficiently sampled.
Field Data Collection
- Collect the data according to the manufacturer’s instructions on system operation, beginning with the instrument aligned on the appropriate start location on the coordinate system. The operator should complete the scan collection systematically along the test grid in both directions, with notes and documentation gathered where appropriate.
- Review the data in realtime while scanning the area to ensure data are actually being gathered and meet a minimum quality standard.
- Mark, if desired, features onsite with marking paint as they are discovered during scanning.
- Perform a quality-control review of the onscreen output that is sent to permanent storage (hard drive, flash drive, memory stick, or another medium) after completing the scanning.
Data Processing
Some modern software packages include tools for presenting and mapping anomalies in the conductivity measurements as a function of their GPS position. However, the traditional output of an FDEM data acquisition tends to be a table where each row represents a date- and time-stamped measurement with columns for relevant equipment settings, conductivity measurements, and GPS position.
Data Interpretation
By using typical computer applications for plotting, individual line scans can be presented as either scatterplots of conductivity measurements or two-dimensional contour maps where the position in the map is set by the GPS position, with the contour and color scaling representing the respective conductivity measurement. In either presentation approach, the goal for the analyst reviewing the data is to identify local anomalies where a significant change in average conductivity is observed. These local anomalies can then be mapped across the area of investigation to identify consistent patterns where they align to form what appears to be a continuous subsurface structure, such as a buried utility.
Advantages
- Well-established field data collection processes.
- Rapid test method with an operator-portable hardware system.
- Reliable and repeatable method, especially for utilities made of metal.
- Real-time marking of utility features when used by an expert operator.
Limitations
- Advanced expertise and training are needed for data collection, processing, and interpretation.
- Data are negatively influenced by significant moisture content or clay in the area under investigation as well as surface metallic objects such as fences or sewer lids.
- PVC, fiber optics, or concrete utilities cannot be detected, as they are nonconductive.
- Calibration with other NDE methods and other ground-truth activities is required, especially when depth-of-feature measurements are desired.
References
- Young, G. N., and C. M. Kennedy. 2015. Utility-Locating Technology Development Using Multisensor Platforms. Report No. S2-R01B-RW-1. Washington, DC: The National Academies Press.
- Reiter, D., V. Napoli, J. Cohen, S. Boone, P. Moseley, A. Alhasan, and J. Salerno. 2023. Availability, Feasibility, and Reliability of Available Nondestructive Evaluation (NDE) Technologies for Detecting and Locating Buried Utilities. Washington DC: Federal Highway Administration.
- American Society of Civil Engineers. 2002. Standard Guidelines for the Collection and Depiction of Existing Subsurface Utility Data. New York, NY: American Society of Civil Engineers.


