


Bridge - Automated Sounding
Target of investigation
Automated sounding is mainly used to detect delamination in plate-like concrete structures, such as bridge decks. Depending on vendors, the system can also reveal the plate thickness of intact areas and characterize the size and depth of delaminated areas using advanced data processing algorithms.(1) This web page only covers using automated sounding systems for detecting delamination in concrete bridge decks.
Description
Automated sounding is similar to traditional chain-drag or hammer sounding but runs in an automated way. An automated sounding system consists of dragging chains, hammers, or steel rods as impactors and air-coupled acoustic sensors, such as microelectromechanical system microphones, for data acquisition. The system can be cart based, as shown in figure 1. The system can also be towed by a vehicle, enabling rapid, nondestructive evaluation of concrete bridge decks at approximately 20 mph (30 km/h) in lieu of complete lane closures.(2)

Physical Principle
Performing chain dragging or hammer sounding on a moderate to severely delaminated area in concrete plate-like structures, where the lateral extension of the discontinuity is much larger than its depth, excites flexural oscillation from about 1 kHz–3 kHz. This oscillation is within the auditable frequency range (about 20 Hz–20 kHz) of humans and sounds “hollowly.”
Data Acquisition
For a complete test procedure for sounding, refer to ASTM Standard D4580/D4580M-12, Standard Practice for Measuring Delaminations in Concrete Bridge Decks by Sounding.(3)
Before conducting the test, any accumulation of debris on the deck must be removed. The automated sounding system rolls over the bridge deck, scanning the entire surface by chain dragging or tapping with the steel rod or hammer. For hammer sounding, a time interval should be selected based on testing purposes. A shorter time interval represents a closer scanning space. Closer scanning spacings are typically used for indepth analyses, and wider spacings are generally used for condition surveys of the bridge deck.
Data Processing
Data processing includes performing a spectrum analysis using the fast Fourier Transform to transform time-series sonic signals into amplitude spectrums in the frequency domain.(4) Peaks in the amplitude spectrum represent dominant frequency components in the collected data. Because data are collected continuously at the speed of the mounting vehicle, the short-time Fourier Transform can be used to generate a spectrogram that has both frequency and time information. With a known moving speed of the vehicle, the time axis can be mapped to the longitudinal length of the scanning area.
Noises may exist in the collected data. A field test report from the Nebraska DOT showed that traffic noises did not affect the test because their frequency amplitudes are only 10 percent of that represented in a delaminated area.(4) Still, careful examinations are needed to identify and filter out noises from the measuring system. The same report showed that a noticeable level of noise around 15 kHz was caused by clapping between chain links.
Data Interpretation
When a concrete plate is in its intact condition, the thickness mode of the plate dominates the collected signal, and a clear ringing sound will be heard. The frequency of the thickness mode corresponds to the zero-group-velocity frequency of the S1 Lamb mode, which depends on the plate thickness, concrete material, and Poisson’s ratio.(5) In shallow delaminated areas, flexural oscillation with a frequency lower than the thickness mode dominates the sonic signal, and a dull or hollow sound is emitted. This acoustic characteristic can help identify delaminated areas. Results are often described in contour maps that mark out delaminated areas, as shown in figure 2. More laboratory and field-testing results may be found in these reports.(6,7)
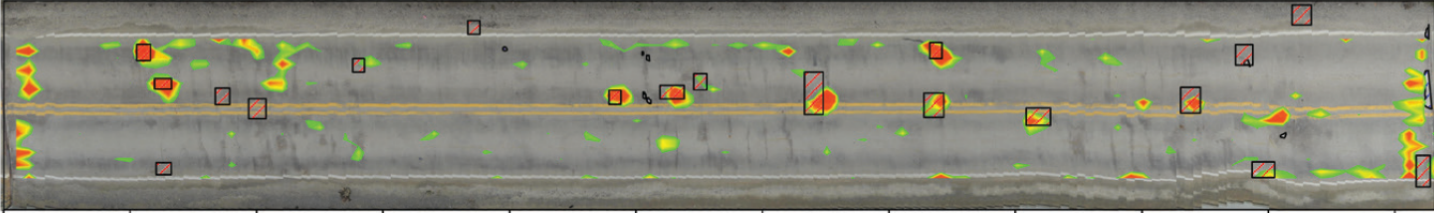 © 2022 Bridge Diagnostics, Inc. (BDI).
Advantages
- Agrees with the manual-sounding results but runs much faster.
- Eliminates a complete lane closure of the system if towed by a vehicle.
- Identifies severe to moderate delamination that reasonably agrees with manual sounding.
- Enables data storage for further investigation.
Limitations
- Moderate to significant expertise and training is required for equipment setup and data collection, processing, and interpretation.
- Careful noise analysis and filtering is typically required.
- Special analysis is needed for delamination detection on decks with asphalt overlays.
References
- Hajin, C., S. Shams, and H. Azari. 2018. “Frequency Wave Number–Domain Analysis of Air-Coupled Impact-Echo Tests in Concrete Slab.” American Society of Civil Engineers Journal of Infrastructure Systems 24, no 3: 04018015.
- Azari, H. 2021. “How 10 States Use, Evaluate, and Implement Nondestructive Evaluation Technology.” Public Roads 85, no. 2: 13–22.
- ASTM. 2012. Standard Practice for Measuring Delaminations in Concrete Bridge Decks by Sounding. ASTM D4580/D4580M-12. West Conshohocken, PA: ASTM International.
- Sun, H., and J. Zhu. 2018. Automated Chain Drag Testing. Report No. SPR-P1(16)M041. Lincoln, NE: Nebraska DOT.
- Gibson, A., and J. S. Popovics. 2005. “Lamb Wave Basis for Impact-Echo Method Analysis.” American Society of Civil Engineers Journal of Engineering Mechanics 131, no. 4: 438–443.
- Gucunski, N., A. Imani, F. Romero, S. Nazarian, D. Yuan, H. Wiggenhauser, P. Shokouhi, and A. Taffe. 2012. Nondestructive Testing to Identify Concrete Bridge Deck Deterioration. SHRP 2 Report S2-R06A-RR-1. Washington, DC: The Transportation Research Board.
- Popovics, J. S. 2010. Investigation of a Full-Lane Acoustic Scanning Method for Bridge Deck Nondestructive Evaluation. Final Report for Highway IDEA Project 134. Washington, DC: The Transportation Research Board.