Bridge - Acoustic Tomography
Target of investigations
Acoustic tomography is beneficial in detecting the deteriorated regions of wood members.
Description
First developed for inspecting urban trees, acoustic tomography has also been used for inspecting in-service wood members such as columns and piles. Compared to the other nondestructive evaluation (NDE) techniques, acoustic tomography provides a more detailed assessment of the internal condition of wood members by providing two-dimensional (2D) images of a member’s cross section.(1)
Physical Principle
Tomographic inversion involves creating 2D images of a member cross section (representing the distribution of velocity) by using the stress wave data from multiple transmitters and receivers attached to the sides of the member. The technique uses acoustic impulse as the energy source, and it commonly estimates the time of flight (TOF) to assess the wave velocity along multipaths between transmitters and receivers. TOF is the time it takes for an acoustic wave to travel between transmitter and receiver. Because the wave velocity is directly related to the density and elastic properties of wood, the areas with lower velocities can indicate the deteriorated regions of wood members.(1)
The frequency of stress waves, distance between sensors, and type of algorithm used to construct the tomographic images can affect the accuracy of acoustic tomography in identifying deteriorated regions.(1)
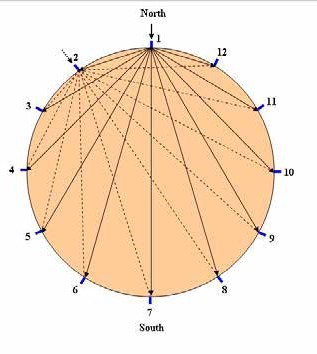
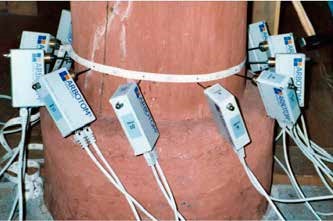
For the TOF measurements, acoustic tomography commonly uses 8–12 sensors to obtain images with sufficient resolution (figure 1). For higher resolution images, 24–36 sensors may be required. The sensors are typically connected to members using pins or nails, and a steel hammer strikes them sequentially to generate acoustic waves. In ultrasonic tomography, piezoelectric transducers attached to wood members using gel-type couplant are used to generate and receive stress waves. For field applications, a flexible mounting frame can facilitate the sensor installment and testing.(2)

A. Sensor Arrangement.
Note: Straight lines represent the sound paths when location 1 is the transmitter and the rest of the locations are receivers.

B. Sensor attachment.
Data Acquisition
The acoustic tomography equipment generally involves a series of low-noise piezoelectric sensors, cables, tape, or caliper to measure the member dimension and distance between sensor locations, pins for attaching sensors, an amplifier, steel hammer, rechargeable batteries, and processing software. Depending on the number of sensors used during the test and the accessibility of the test location, scanning of a member cross section can take between 20–30 min.(1)
The test procedure is as follows:
- Identify the test location, and measure its circumference using a tape measure.
- Determine the number of sensors to be used.
- Mark the starting point (sensor number one) at a test location, and use a tape measure to mark the position of sensors around the cross section.
- Drive the attachment pins into the wood member using a hammer, and attach the piezoelectric sensors to the pins. Insert spiked sensors directly into a wood member.
- Measure the distances between the sensors, and enter the measured data into the software.
- Start the test by tapping sensors sequentially with a steel hammer starting from sensor number one to generate stress waves.
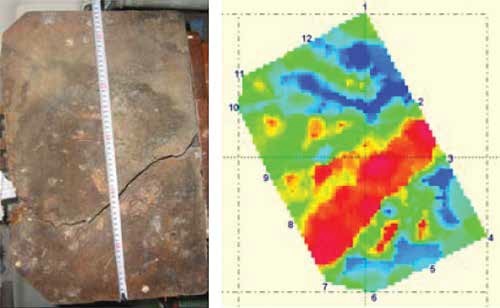
The software produces a 2D color tomogram showing the geometry of the cross section and the distribution of TOF values (figure 2).

Figure 2. Photo and contour map. Cross section and acoustic tomography of a timber member at the Imperial Palace in Beijing, China(1)
Data Processing
The TOF data are analyzed in the acoustic tomography software to create a 2D tomogram.
Data Interpretation
The 2D tomogram represents the distribution of velocities in the cross-section of wood members. The results are qualitative.
Advantages
- Compared to other NDE techniques, a 2D tomogram provides a more detailed assessment of wood members.
- 2D tomogram is useful in scanning members with large cross sections.
Limitations
- The current acoustic tomography techniques are primarily based on TOF measurements, which limit the accuracy and resolution of the tomographic images obtained. They are typically sensitive to moderate- to severe state of decay rather than early-stage decay.
- The construction of tomograms from the TOF data is affected by the pronounced anisotropic nature of wood materials.
- The results are qualitative, and additional testing is recommended, such as resistance microdrilling, to obtain quantitative local information. Additional testing can confirm the condition of a wood member.
Refrences
- White, R. H., and R. J. Ross (2014). Wood and timber condition assessment manual. General Technical Report FPL-GTR-234. Madison, WI: U.S. Department of Agriculture, Forest Service, Forest Products Laboratory.
- Rinn, F. 2006. “Mobile Techniques for Tree and Timber Assessment.” Workshop presented at International Union of Forest Research Organization on Nondestructive Testing of Wood. Harbin, China: International Union of Forest Research Organization.


