Pavements - Electrical Resistivity (ER)
Target of Investigation
Electrical resistivity (ER) testing is used to characterize the corrosive nature of steel reinforced–concrete structures, including reinforced concrete pavement. It is primarily employed for the following applications:
- Characterizing the susceptibility of reinforced concrete to corrosion.
- Identifying concrete sections susceptible to moisture or chloride penetration.
ER measurement can also be used to complement other nondestructive evaluations that assess corrosion, such as half-cell potential (HCP), which describes the probability of corrosion activity.(1) ER cannot be used with electrically isolating surface layers, such as asphalt pavements or asphalt overlays on concrete pavements.
Research has been conducted on applications of ER, such as measuring thickness of pavements, indicating chloride permeability (surface resistivity), determining the depth of frost penetration, and monitoring the infiltration of water into a pavement section using electrical resistance thermography.(2–5) These applications were all found to be too undeveloped or unrefined for use in the field.
Description
The presence and concentrations of water and chlorides are important parameters when characterizing a corrosive environment in reinforced concrete.(1) ER is an effective method for assessing the susceptibility of reinforced concrete to this corrosive environment.(6) Damaged and cracked areas resulting from increased porosity become preferential paths for fluid and ion flow, creating an environment conducive to corrosion. Conductive environment allows a current to pass between anodic and cathodic sites on the steel reinforcement. The higher the ER value of a concrete, the lower this current will be.(1) As such, low ER values are indicative of an environment that supports corrosion and typically leads to high corrosion rates.(6)
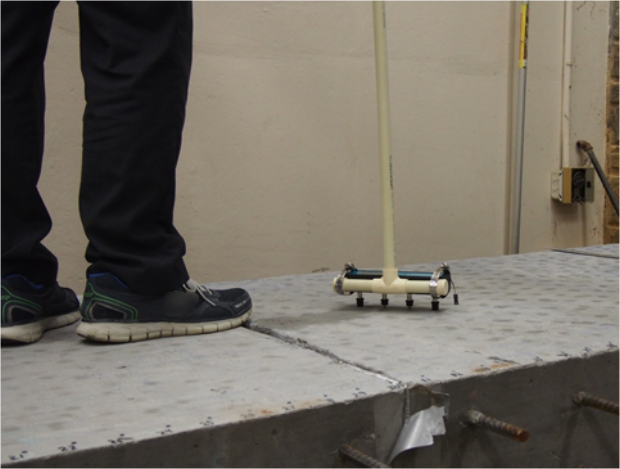
The ER measurement system usually consists of a four-electrode Wenner probe and a data acquisition device (figure 1). Measurements are taken by pressing the probe against a damp concrete surface; the ER value displayed on the probe itself or an attached device (e.g., a tablet) is recorded.(6) Figure 2 shows an ER measurement being taken in the field.
 Source: FHWA.A. Top view.
 Source: FHWA.
Physical Principle
ER and its reciprocal, conductivity, are properties that quantify a material’s ability to oppose and conduct, respectively, an electric current. ER is measured in units of ohm-centimeter (Ω-cm) or Ω-m in metric units and ohm-inch (Ω-inch) or microhm-inch in imperial units. Electrical conductivity in concrete systems primarily results from electrolytic current flow through open‑pore systems between the anodic and cathodic sites on a reinforcement, where damaged and cracked areas become preferential paths for fluid and ion flow.(7) Surface ER measurements of a steel reinforced–concrete structure can be used to characterize the corrosive environment of the concrete. Voltage and current are measured at the surface of the concrete using a Wenner probe (figure 3).(1) Four equally spaced electrodes are galvanically connected to the concrete using a wet sponge on each electrode. A current is applied through the concrete between the two outer electrodes, and the potential of the generated electrical field is measured between the two inner electrodes. The ER is then calculated using the equation shown in figure 4.
 © 2015 N. Gucunski, Rutgers University.
- Where:
- ρ = ER (kΩ-cm).
- a = distance between electrodes (cm).
- V = voltage (V).
- I = current (A).
In general, low ER measurements indicate areas where the environment is conducive to corrosion, while high ER measurements indicate areas where the environment does not facilitate corrosion. Correlations between ER values and corrosion rates of concrete are given in table 1.
Table 1. Correlation between ER values and corrosion rates.(1)
| ER (kΩ-cm) | Corrosion Rate |
| Less than 5 | Very high |
| 5 to 10 | High |
| 10 to 20 | Moderate to low |
| >20 | Low |
Building materials—such as concrete, cement, and wood—are ion conductors, which means that electrical conduction occurs through the interconnected pore space. The resistivity of concrete affects ion current flow between the anodic and cathodic sites on the steel reinforcement that is undergoing corrosion. Dry concrete has a high resistivity that impedes this current, while highly permeable and moist concrete has a low resistivity and is conductive to corrosion currents. The ER of fully saturated concrete is approximately 1–10 Ω-cm (0.393–3.93 Ω-inches), depending on the conductivity of the saturating fluid. When concrete is oven dried, the resistivity can be as high as 100 kΩ-cm (39.3 Ω-inches) causing it to act as an insulator.(1) Since concrete is a composite material, its ER depends on its porosity, pore-size distribution, cement chemistry, water-to-cement ratio, presence of admixtures, ion type, saturation fluid, and other factors. Field ER measurements can be affected by the concrete’s surface-level moisture, carbonation, and any steel reinforcement in the vicinity of the electrodes.(1)
Data Acquisition
Currently, there is no ASTM standard for using a Wenner probe to measure the ER of a reinforced concrete structure. ASTM G57-06(2012), Standard Test Method for Field Measurement of Soil Resistivity Using the Wenner Four-Electrode Method, can serve as a guideline, but the two applications have differences.(8) The typical procedure for data collection on a reinforced concrete structure is detailed below:
- Identify locations or lay out a grid for data collection on the concrete surface.
- Ensure galvanic connection between probe electrodes and the concrete surface. Note the following:
- If the concrete surface is dry, prewet each test location with water, contact graphite gel, or pastes.
- Do not overwet the surface as it may contribute to probe-to-probe current flow along the surface.(7)
- Make sure sponges on the probe electrode ends are always kept wet.
- Place the Wenner probe against the surface with the center of the probe oriented at the test location.
- Record the measured ER value.
- Repeat for each test location.
Data Processing
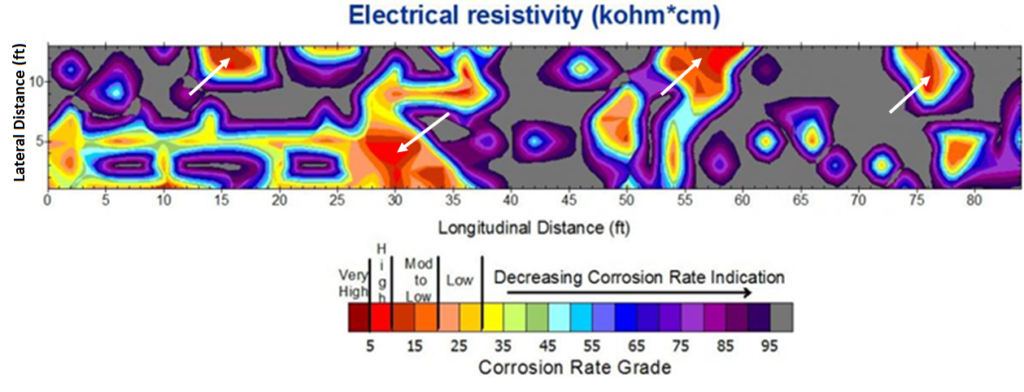
Data processing is not complicated and consists mostly of plotting raw data.(1) This generally produces a contour map of the measured ER displayed with the spatial distribution of the test locations (figure 5).

1 ft = 0.3 m; 1 kΩ-cm = 0.39 Ω-inch.
Note: Arrows indicate areas with very low ER.
Figure 5. Contour map. Plotted ER measurements.(1)
Data Interpretation
Data interpretation can be challenging because the ER of a concrete depends on several material properties, including moisture content, salt content, and porosity; delineating each property’s specific contribution to the whole is difficult.(1)
Advantages
Advantages of taking ER measurements using the Wenner probe include the following:
- Fairly easy-to-use system that requires little training.(7)
- Straightforward data processing.
- Reliable, precise, and accurate measurements.(7)
- Robust and relatively inexpensive.(7)
- Complementary to HCP surveys.
Limitations
Limitations of taking ER measurements using the Wenner probe include the following:
- Unable to measure corrosion rate.
- Challenging, complex data interpretation because of multiple contributing factors.
- Potential for probe-to-probe current flow.
- Ineffective on electrically isolating surface layers, such as asphalt pavement and asphalt overlays.
References
- Gucunski, N., Imani, A., Romero, F., Nazarian, S., Yuan, D., Wiggenhauser, H., Shokouhi, P., Taffee, A., and Kutrubes, D. (2013). Nondestructive Testing to Identify Concrete Bridge Deck Deterioration, Report No. S2-R06A-RR-1, Transportation Research Board, Washington, DC.
- Moore, R.W. (1972). Electrical Resistivity Instruments for Measuring Thickness and Other Characteristics of Pavement Layers, Report No. FHWA-RD-73-2, Federal Highway Administration, Washington, DC.
- Tanesi, J. and Ardani, A. (2012). TechBrief: Surface Resistivity Test Evaluation as an Indicator of the Chloride Permeability of Concrete, Report No. FHWA-HRT-13-024, Federal Highway Administration, Washington, DC.
- Selezneva, O.J., Jiang, Y.J., Larson, G., and Puzin, T. (2008). Long Term Pavement Performance Computed Parameter: Frost Penetration, Report No. FHWA-HRT-08-057, Federal Highway Administration, Washington, DC.
- Buettner, M., Daily, B., and Ramirez, A. (1997). Electrical Resistance Tomography for Monitoring the Infiltration of Water into a Pavement Section, Report No. UCRL-ID-128051, U.S. Department of Energy, Washington, DC.
- Federal Highway Administration. (2016). “Nondestructive Evaluation Laboratory Overview.” (website) Washington, DC. Available online: https://highways.dot.gov/laboratories/nondestructive-evaluation-laboratory/nondestructive-evaluation-laboratory-overview, last accessed April 18, 2016.
- Gucunski, N., Romero, F., Kruschwitz, S., Feldmann, R., and Parvardeh, H. (2011). Comprehensive Bridge Deck Deterioration Mapping of Nine Bridges by Nondestructive Evaluation Technologies, Report No. SPR-NDEB(90)–8H-00, Iowa Highway Research Board, Ames, IA.
- ASTM G57-06(2012). (2012). “Standard Test Method for Field Measurement of Soil Resistivity Using the Wenner Four-Electrode Method.” Book of Standards 03.02, ASTM International, West Conshohocken, PA.


